

Question: Please Answer! Question 2 We wish to develop a time series model for the Annual Recreation visitors for Yellowstone National Park using National Park Service
Please Answer!
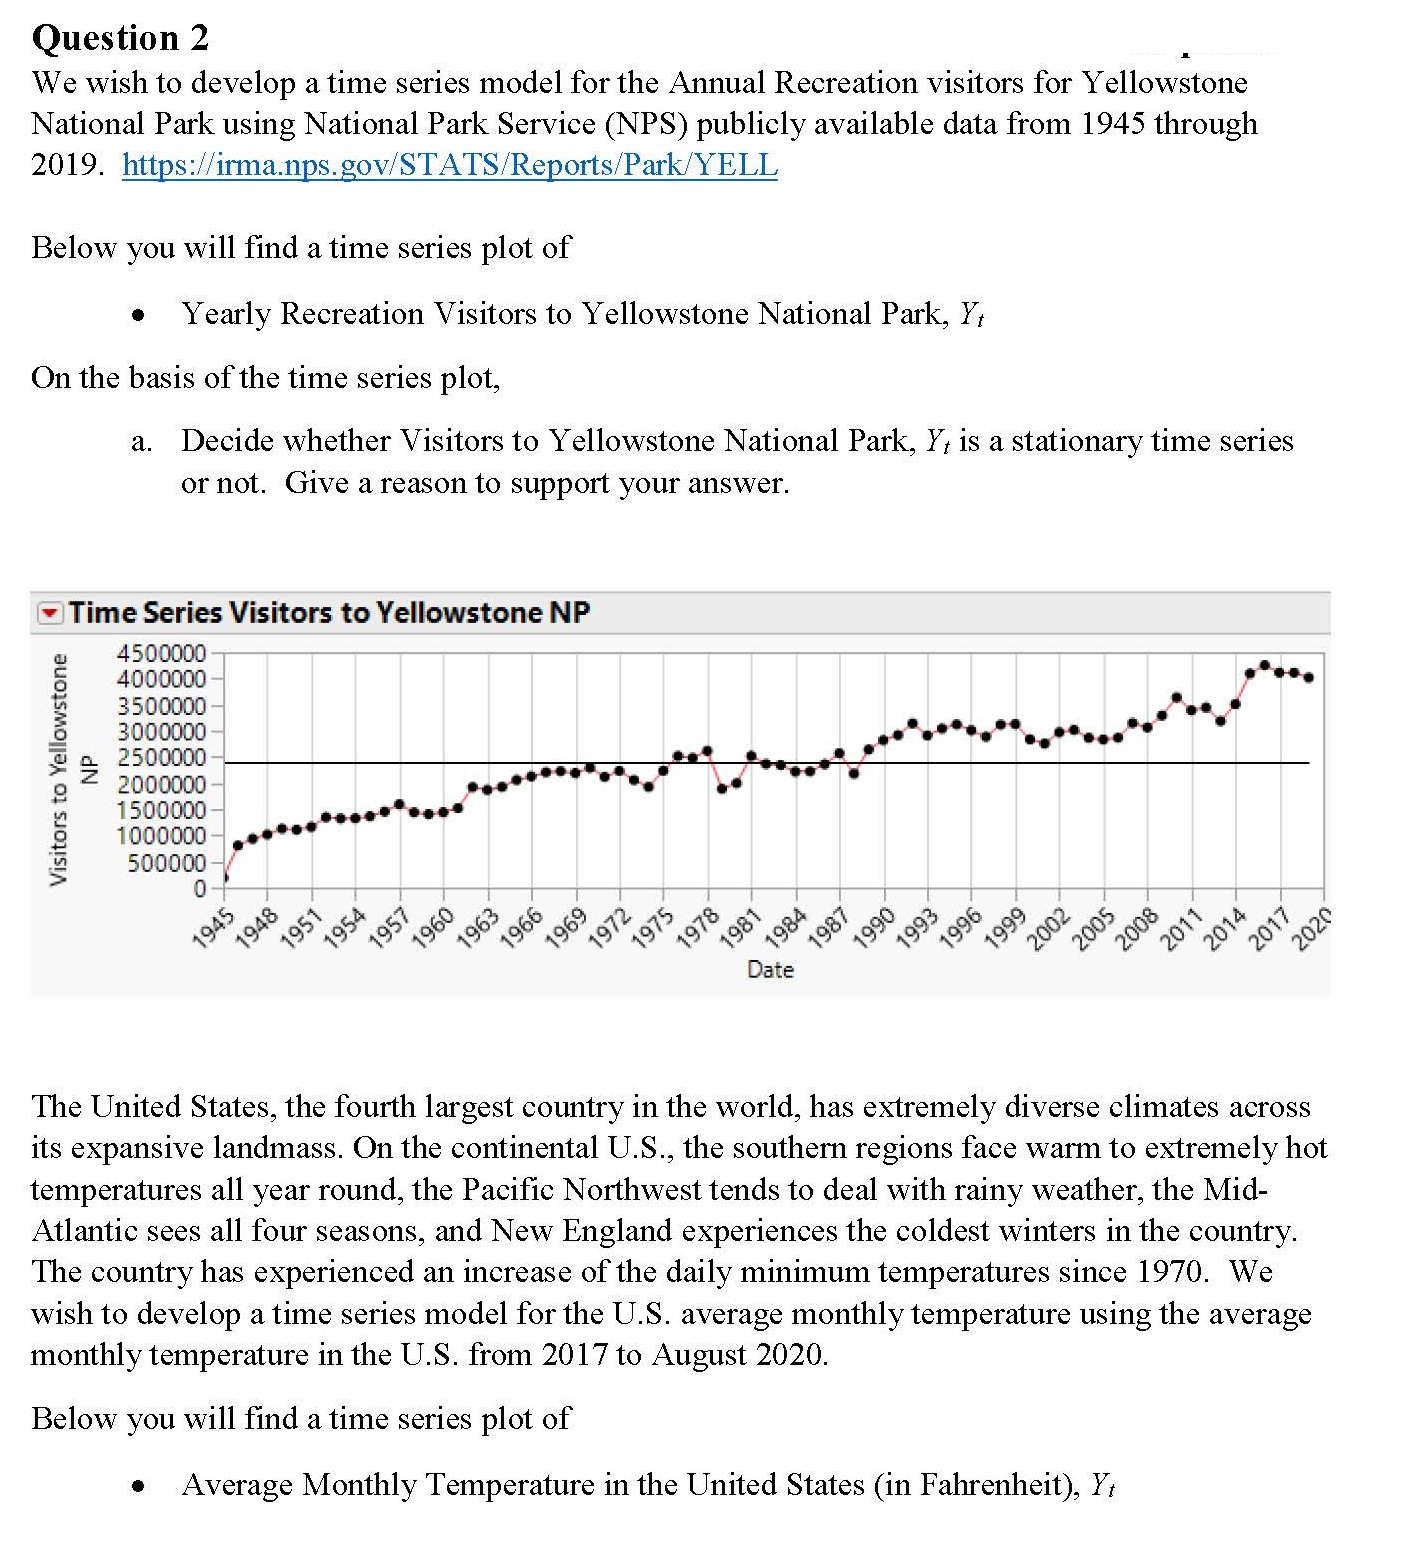
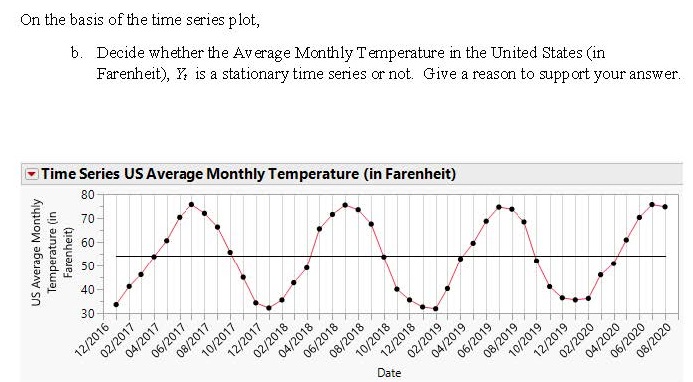
Question 2 We wish to develop a time series model for the Annual Recreation visitors for Yellowstone National Park using National Park Service (NPS) publicly available data from 1945 through 2019. https://irma.nps.gov/STATS/Reports/Park/YELL Below you will find a time series plot of . Yearly Recreation Visitors to Yellowstone National Park, Y, On the basis of the time series plot, a. Decide whether Visitors to Yellowstone National Park, Y, is a stationary time series or not. Give a reason to support your answer. Time Series Visitors to Yellowstone NP Visitors to Yellowstone 4500000 4000000 3500000 3000000 2500000 2000000 1500000 1000000 ......"....".... 500000- 0 945 1948 1951 1954 1957 1960 1963 966 969 972 1975 1978 1981 1987 1990 1993 1996 1999 2002 1984 2005 2008 2011 2014 2017 2020 The United States, the fourth largest country in the world, has extremely diverse climates across its expansive landmass. On the continental U.S., the southern regions face warm to extremely hot temperatures all year round, the Pacific Northwest tends to deal with rainy weather, the Mid- Atlantic sees all four seasons, and New England experiences the coldest winters in the country. The country has experienced an increase of the daily minimum temperatures since 1970. We wish to develop a time series model for the U.S. average monthly temperature using the average monthly temperature in the U.S. from 2017 to August 2020. Below you will find a time series plot of . Average Monthly Temperature in the United States (in Fahrenheit), YOn the basis of the time series plot, US Average Monthly 80 Temperature (in Farenheit) 70 60 50 40 30 12/2016 b. Decide whether the Average Monthly Temperature in the United States (in Time Series US Average Monthly Temperature (in Farenheit) 02/2017 04/2017 Farenheit ), It is a stationary time series or not. Give a reason to support your answer. 06/2017 08/2017 10 /2017 12/2 17 02/2018 04/2018 06/2018 /20 10/2018 12/2018 Date 02/2019 04/2019 06/2019 08/2019 10/2019 12/2019 02/2020 04/20 06/2020 0 2020
Step by Step Solution
There are 3 Steps involved in it

Get step-by-step solutions from verified subject matter experts