

Question: Please answer Question 2.40, 3.2, 3.10 step by step and some explanation. Question 2.40 (please provide the R code) 2.40 Predicting Grinnell house prices. Refer

Please answer Question 2.40, 3.2, 3.10 step by step and some explanation.
Question 2.40 (please provide the R code)


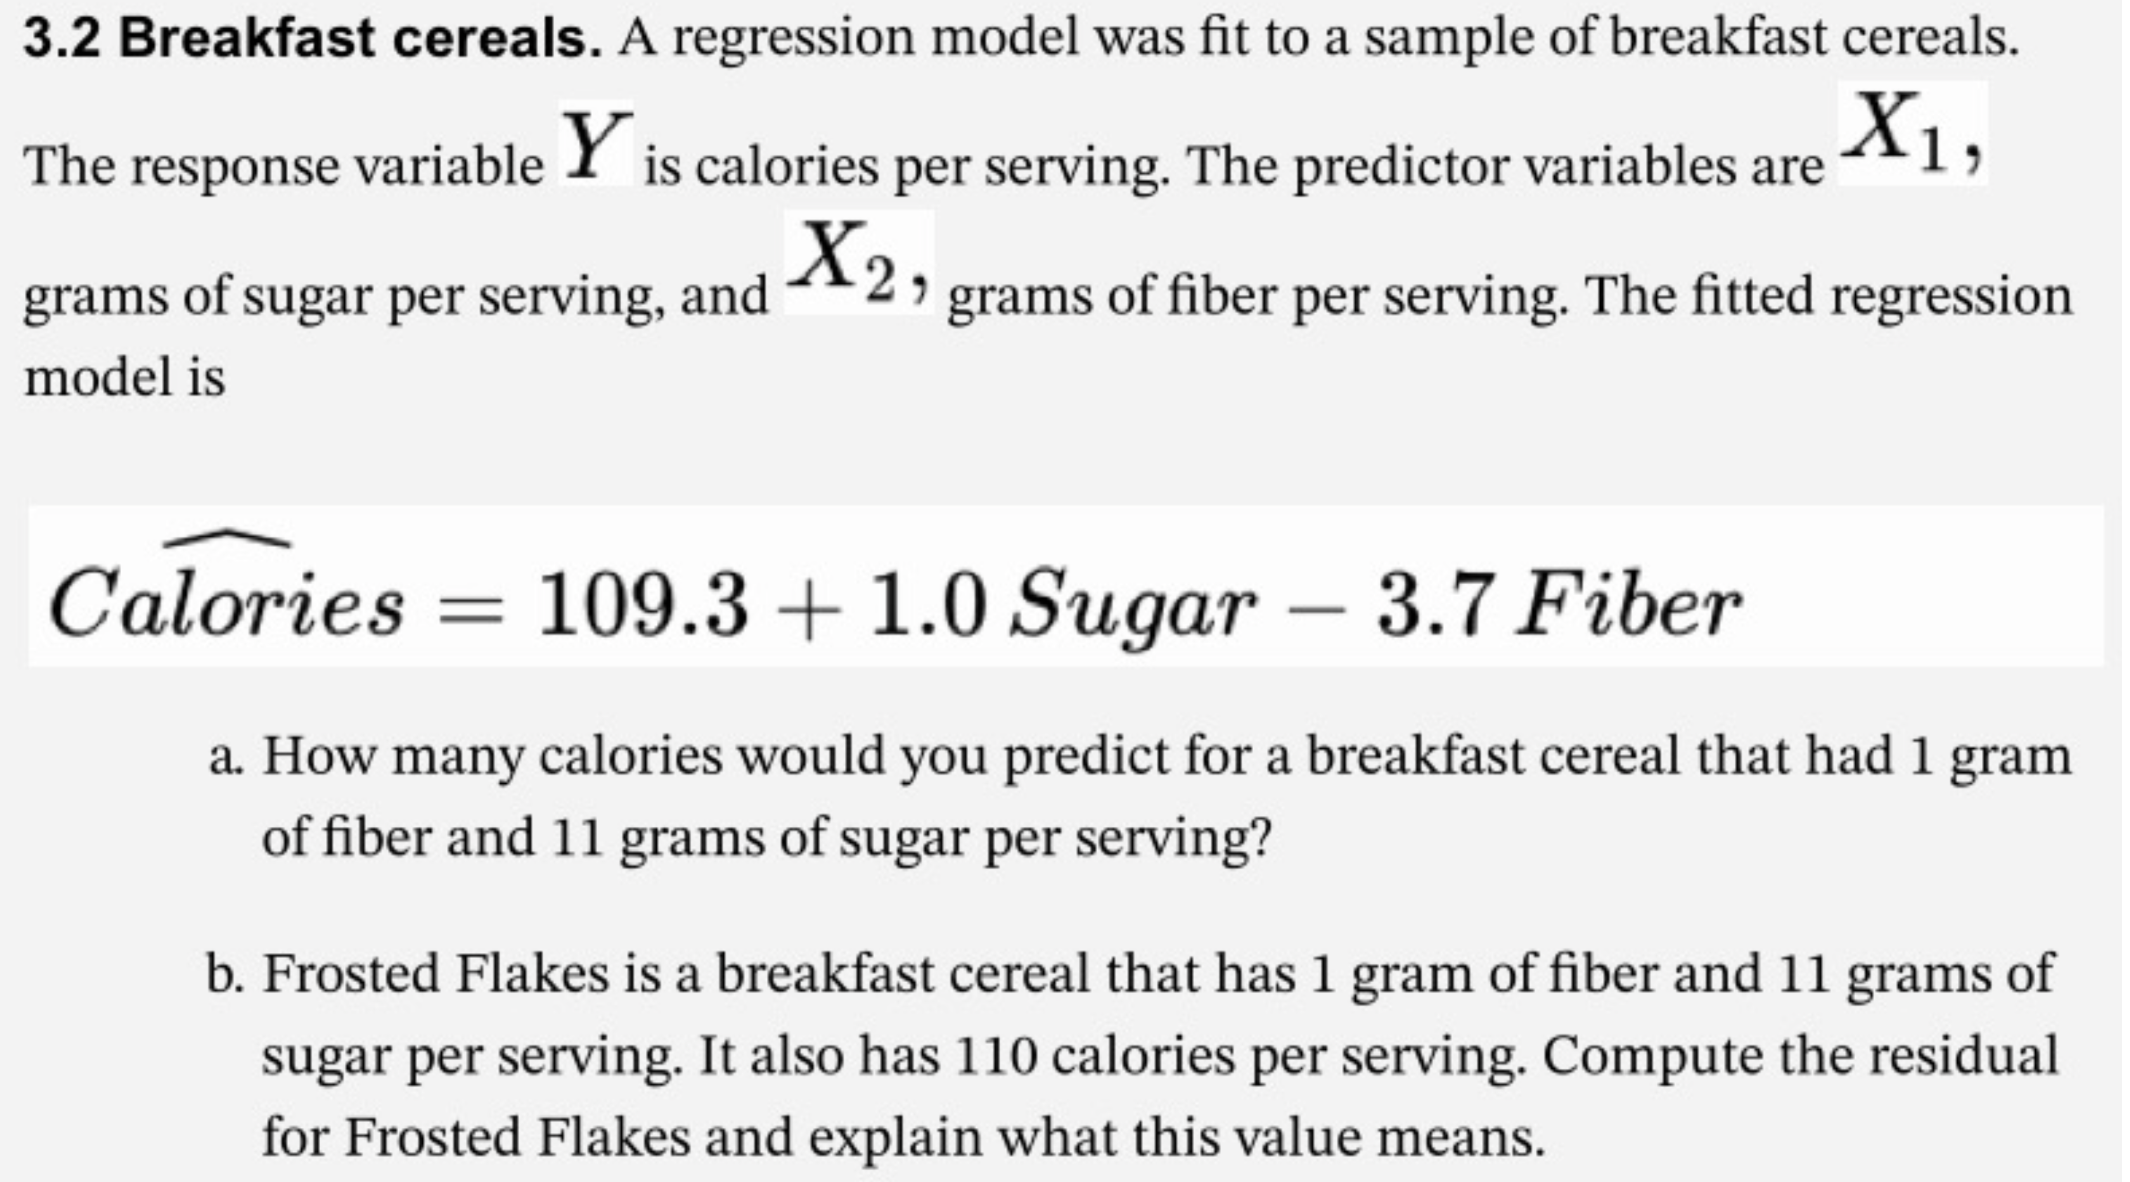
2.40 Predicting Grinnell house prices. Refer to the GrinnellHouses data introduced in Exercise 1.20 and use the simple regression of SalePrice on ListPrice to: h Grinnell a. Find a 90% condence interval for the mean SalePrice of a home that is listed at $300,000. b. Find a 90% prediction interval for the SalePrice of a home that is listed at $300,000. c. Give interpretative sentences for your answers to (a) and (b) so that the distinction between what they mean is clear. 3.2 Breakfast cereals. A regression model was fit to a sample of breakfast cereals. The response variable Y is calories per serving. The predictor variables are X1, grams of sugar per serving, and X 2 , grams of fiber per serving. The fitted regression model is Calories = 109.3 + 1.0 Sugar - 3.7 Fiber a. How many calories would you predict for a breakfast cereal that had 1 gram of fiber and 11 grams of sugar per serving? b. Frosted Flakes is a breakfast cereal that has 1 gram of fiber and 11 grams of sugar per serving. It also has 110 calories per serving. Compute the residual for Frosted Flakes and explain what this value means.3.1 0 Car correlations. Suppose that you are interested in predicting the price of used cars using the explanatory variables current mileage (Mileage) and year of manufacture (Year). a. Do you think that Year and Mileage are positively or negatively correlated? Explain. b. For a xed manufacture year, would you expect Mileage to be positively or negatively correlated with Price
Step by Step Solution
There are 3 Steps involved in it

Get step-by-step solutions from verified subject matter experts