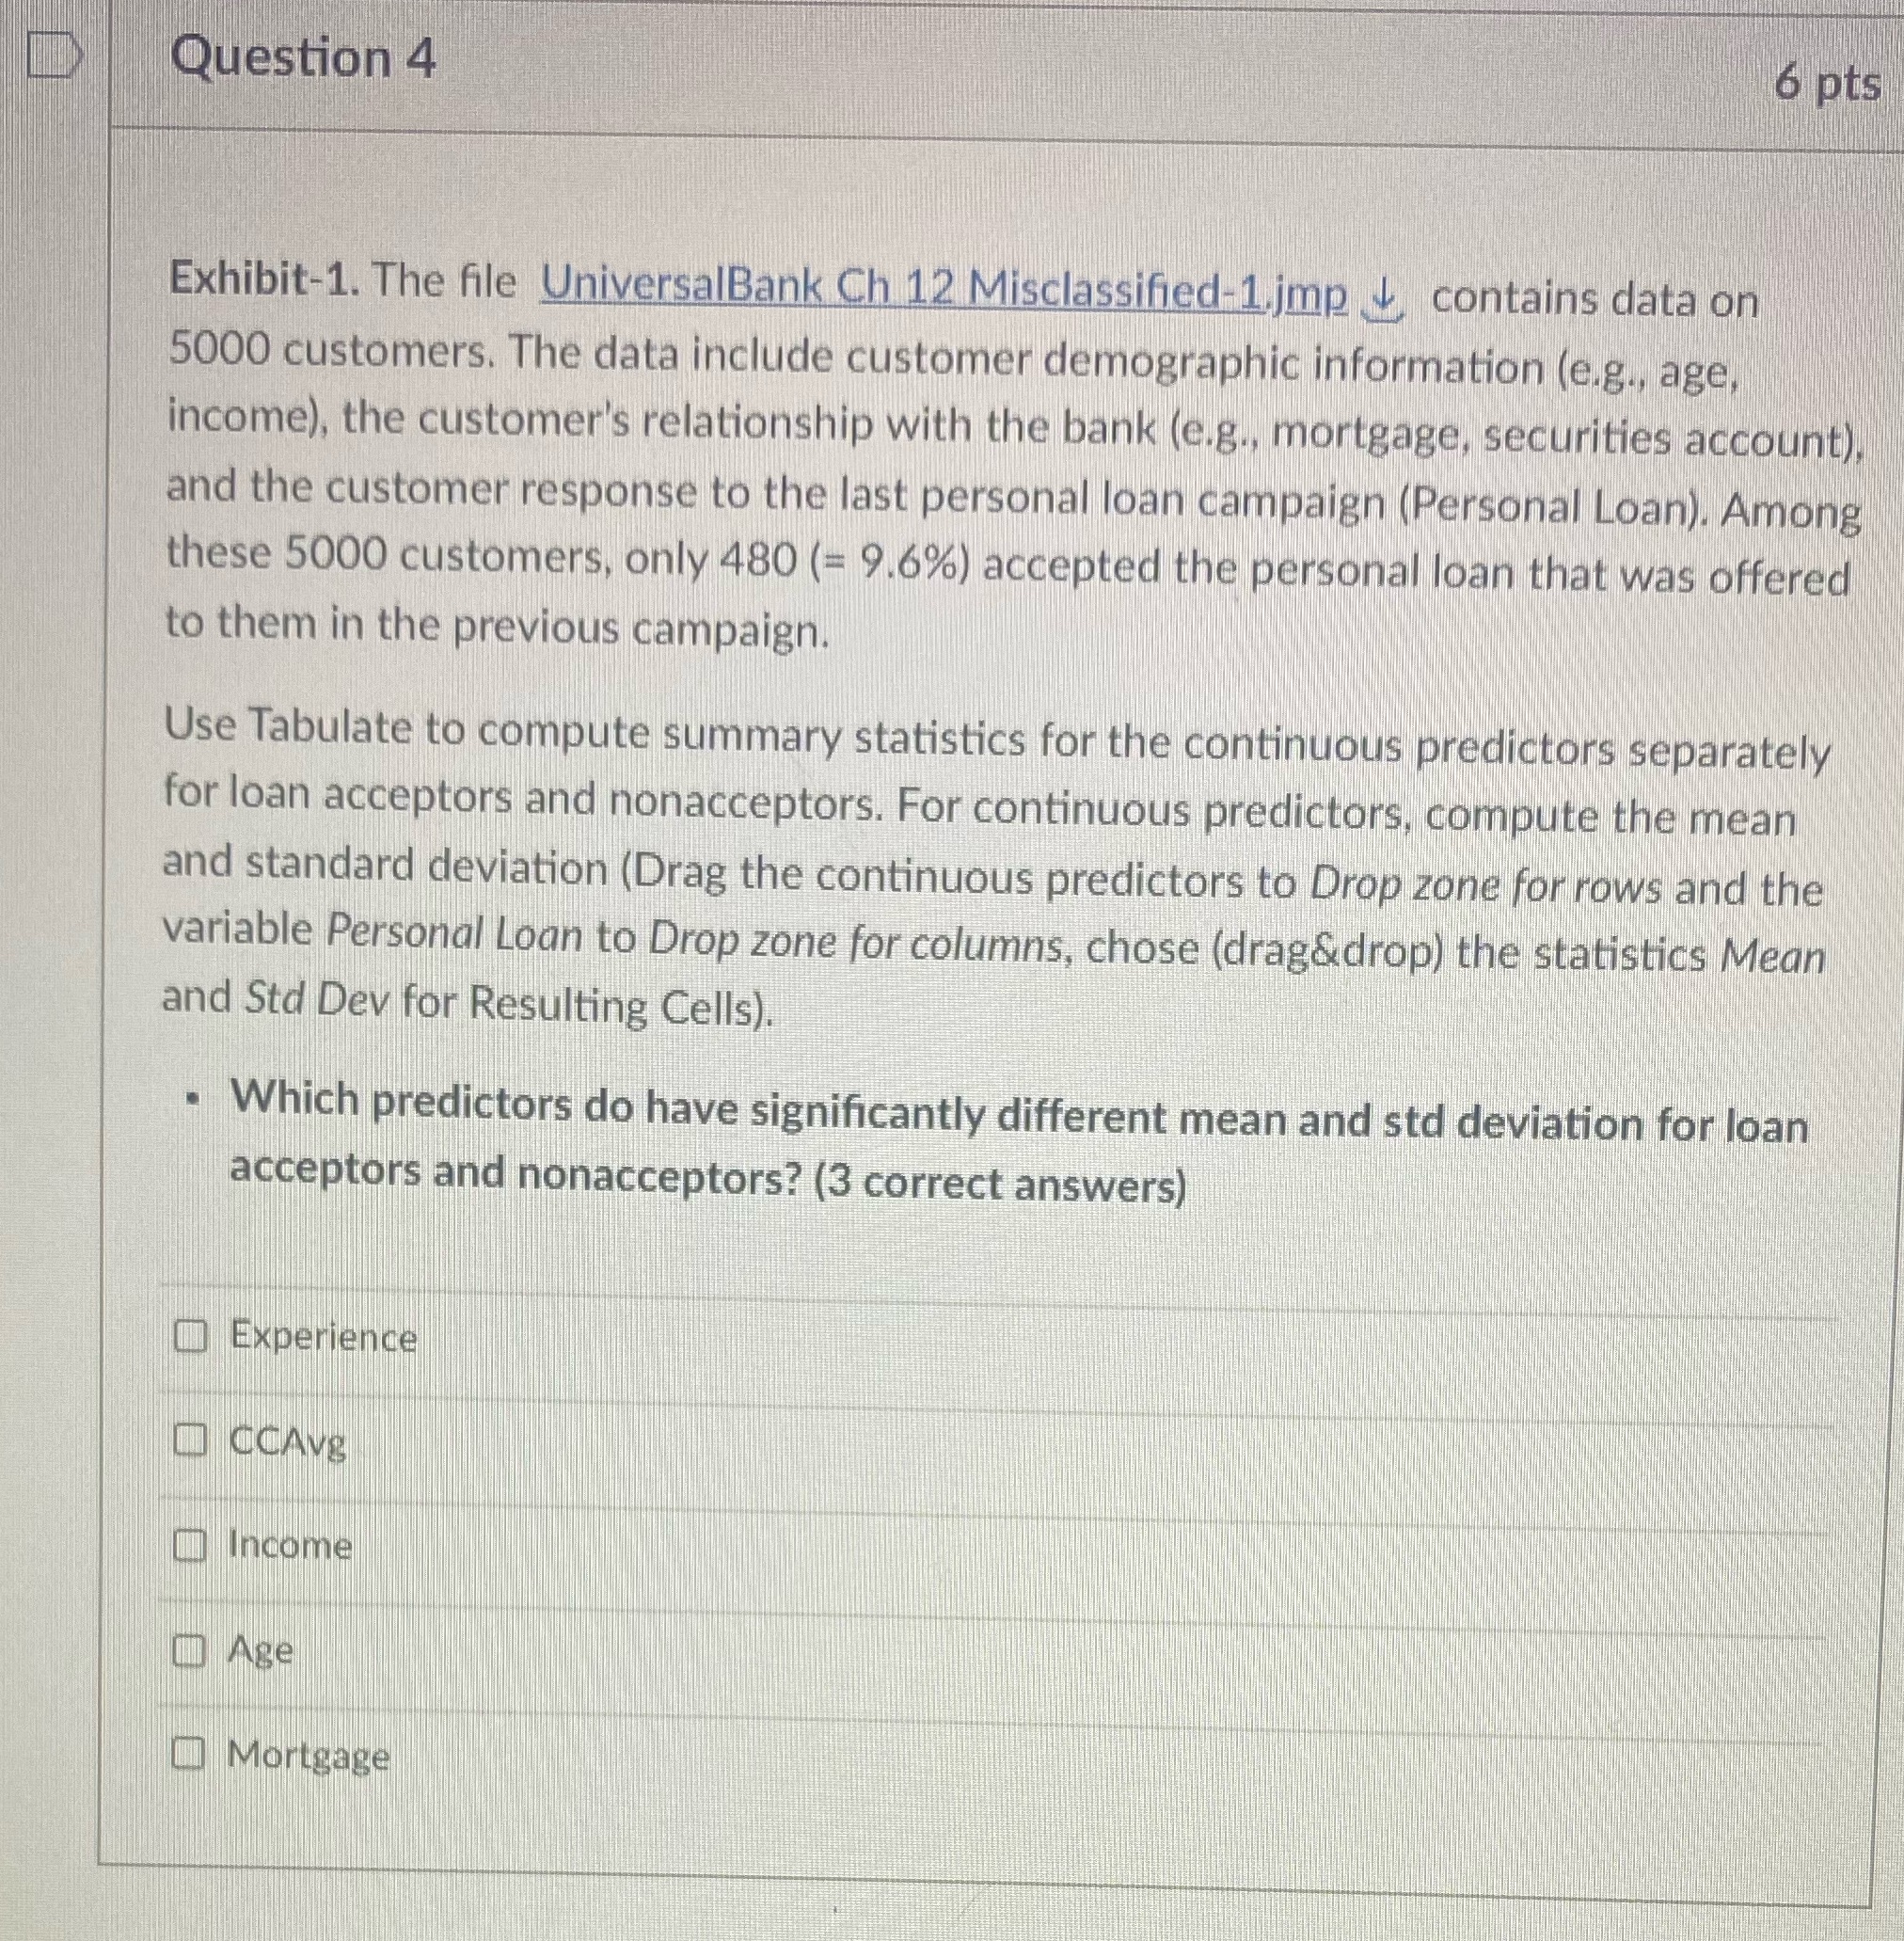
Question: Please answer Question 4 6 pts Exhibit-1. The file UniversalBank Ch 12 Misclassified-1.jmp + contains data on 5000 customers. The data include customer demographic information

Please answer

Please answer Question 4 6 pts Exhibit-1. The
Question 4 6 pts Exhibit-1. The file UniversalBank Ch 12 Misclassified-1.jmp + contains data on 5000 customers. The data include customer demographic information (e.g., age. income), the customer's relationship with the bank (e.g., mortgage, securities account) and the customer response to the last personal loan campaign (Personal Loan). Among these 5000 customers, only 480 (= 9.6%) accepted the personal loan that was offered to them in the previous campaign. Use Tabulate to compute summary statistics for the continuous predictors separately for loan acceptors and nonacceptors. For continuous predictors, compute the mean and standard deviation (Drag the continuous predictors to Drop zone for rows and the variable Personal Loan to Drop zone for columns, chose (drag&drop) the statistics Mean and Std Dev for Resulting Cells). . Which predictors do have significantly different mean and std deviation for loan acceptors and nonacceptors? (3 correct answers) Experience CCAVE Income Age Mortgage

Step by Step Solution

There are 3 Steps involved in it

1 Expert Approved Answer
Step: 1 Unlock blur-text-image
Question Has Been Solved by an Expert!

Get step-by-step solutions from verified subject matter experts

Step: 2 Unlock
Step: 3 Unlock

Students Have Also Explored These Related Finance Questions!