

Question: please answer question at bottom as well as fill out full graph. include points and lines for operating costs, sales revenue, and break even point.
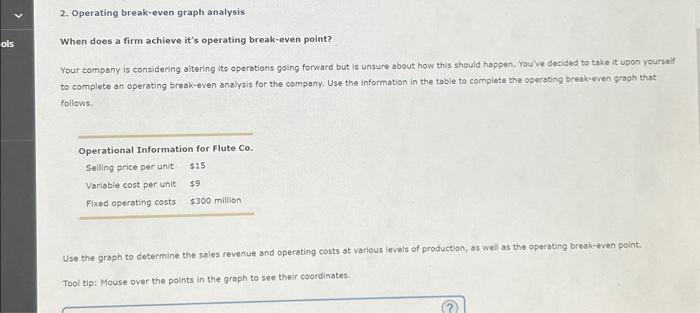
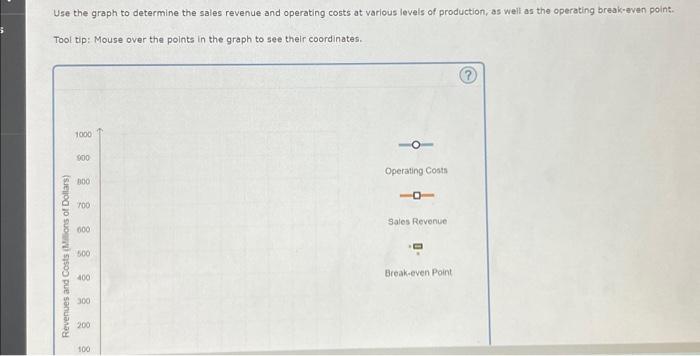
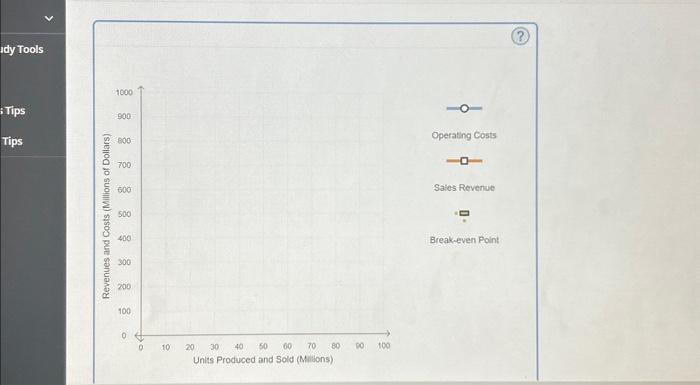
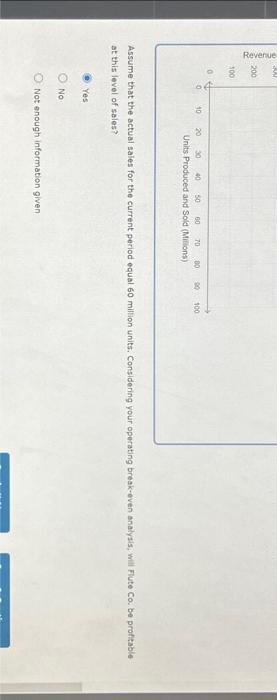
2. Operating break-even graph analysis When does a firm achieve it's operating break-even point? Your company is considering altering its operations going forward but is unsure about how this should happen. You've decided to take it upon yourseif to complete an operating break-even analysis for the company. Use the information in the table to complete the operating braak-even groph that follows. Use the graph to determine the sales revenue and operating costs at various lovels of production, as well as the aperating break-aven point. Tool tip: Mouse over the points in the graph to see their coordinates. Use the graph to determine the sales revenue and operating costs at various levels of production, as well as the operating break-aven point: Tool tip: Mouse over the points in the graph to see their coordinates. (?) Operating Costs Sales Revenue Break-even Point Assume that the actual saies for the current period equal 60 miltion units. Considering your operating break-even analysis, will Flute Co. be proftable at this level of sales? Yes No Not enough information given
Step by Step Solution
There are 3 Steps involved in it

Get step-by-step solutions from verified subject matter experts