

Question: **PLEASE ANSWER QUESTION BELOW AND SHOW COMPUTATIONAL STEP AS WELL*** Please and Thanks A B C D begin{tabular}{l|l|l} E & F & G end{tabular} GH
**PLEASE ANSWER QUESTION BELOW AND SHOW COMPUTATIONAL STEP AS WELL*** Please and Thanks
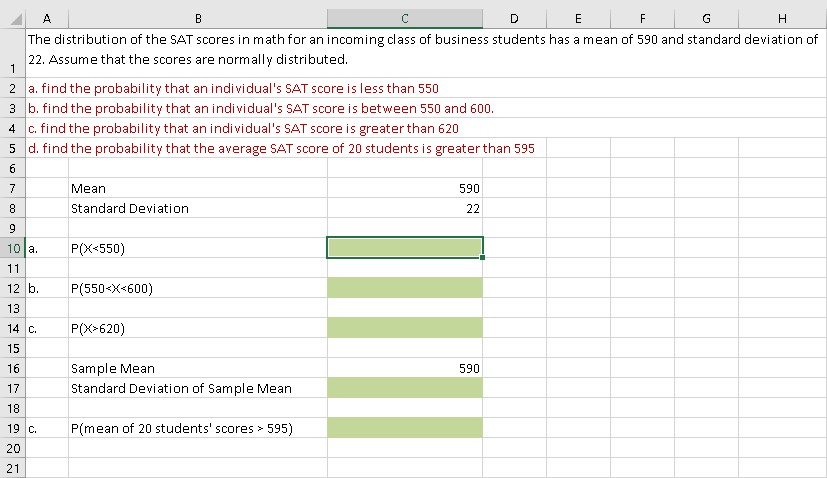
A B C D \begin{tabular}{l|l|l} E & F & G \end{tabular} GH The distribution of the SAT scores in math for an incoming class of business students has a mean of 590 and standard deviation of 22. Assume that the scores are normally distributed. a. find the probability that an individual's SAT score is less than 550 b. find the probability that an individual's SAT score is between 550 and 600. c. find the probability that an individual's 5A S score is greater than 620 d. find the probability that the average 5A A score of 20 students is greater than 595 MeanStandardDeviation59022 a. P(X620) Sample vean 590 Standard Deviation of Sample Mean c. P( mean of 20 students' scores >595)
Step by Step Solution
There are 3 Steps involved in it

Get step-by-step solutions from verified subject matter experts