

Question: please answer question C The following table contains the demand from the last 12 months: c. Based on the simple linear regression results, please answer
please answer question C 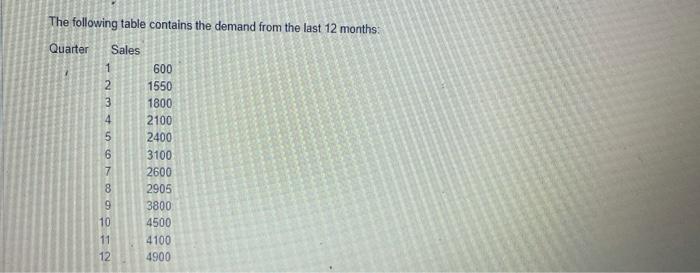

The following table contains the demand from the last 12 months: c. Based on the simple linear regression results, please answer the following questions: 1) What % of the variation in the data is explained by the model? 2) Is there a significant relationship between demand and quarter (significance level a 0.05 )? (yes or no)
Step by Step Solution
There are 3 Steps involved in it
1 Expert Approved Answer
Step: 1 Unlock

Question Has Been Solved by an Expert!
Get step-by-step solutions from verified subject matter experts
Step: 2 Unlock
Step: 3 Unlock