

Question: please answer question( d )and (e) ,provide code and description. dataset will be provided below https://drive.google.com/file/d/17bCsgUEXBRbP79NyO70d37at3GWwMfXT/view?usp=sharing [(1] Given the stock prices {yh t = l,
please answer question( d )and (e) ,provide code and description. dataset will be provided below
https://drive.google.com/file/d/17bCsgUEXBRbP79NyO70d37at3GWwMfXT/view?usp=sharing
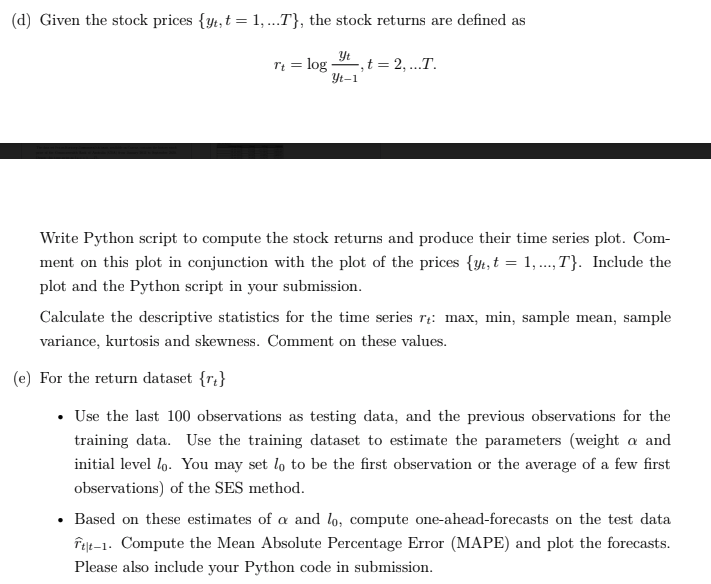
[(1] Given the stock prices {yh t = l, ...T}, the stock returns are dened as r = lo , t = 2, ...T. t 3 911 Write Python script to compute the stock returns and produce their time series plot. Com ment on this plot in conjunction with the plot of the prices {91, t = 1, ...,T}. Include the plot and the Python script in your submission. lGalculate the descriptive statistics for the time series r._: max, min, sample mean, sample variance, kurtcsis and slcewness. lSomment on these values. [a] For the return dataset {rt} . Use the last l observations as testing data, and the previous observations for the training data. Use the training dataset to estimate the parameters {weight or and initial level ll. You ma},r set lg. to be the rst observation or the average of a few rst observations] of the SES method. . Based on these estimates of :1 and In, compute oneaheadforecasts on the test data Fg|f_1. Compute the Mean Absolute Percentage Error [MAPE] and plot the forecasts. Please also include your Python code in submislon
Step by Step Solution
There are 3 Steps involved in it

Get step-by-step solutions from verified subject matter experts