

Question: Please answer question D C. Fill in the empty cells in Table 4.3 using information from Table 4.1 and the World Bank data base of
Please answer question D
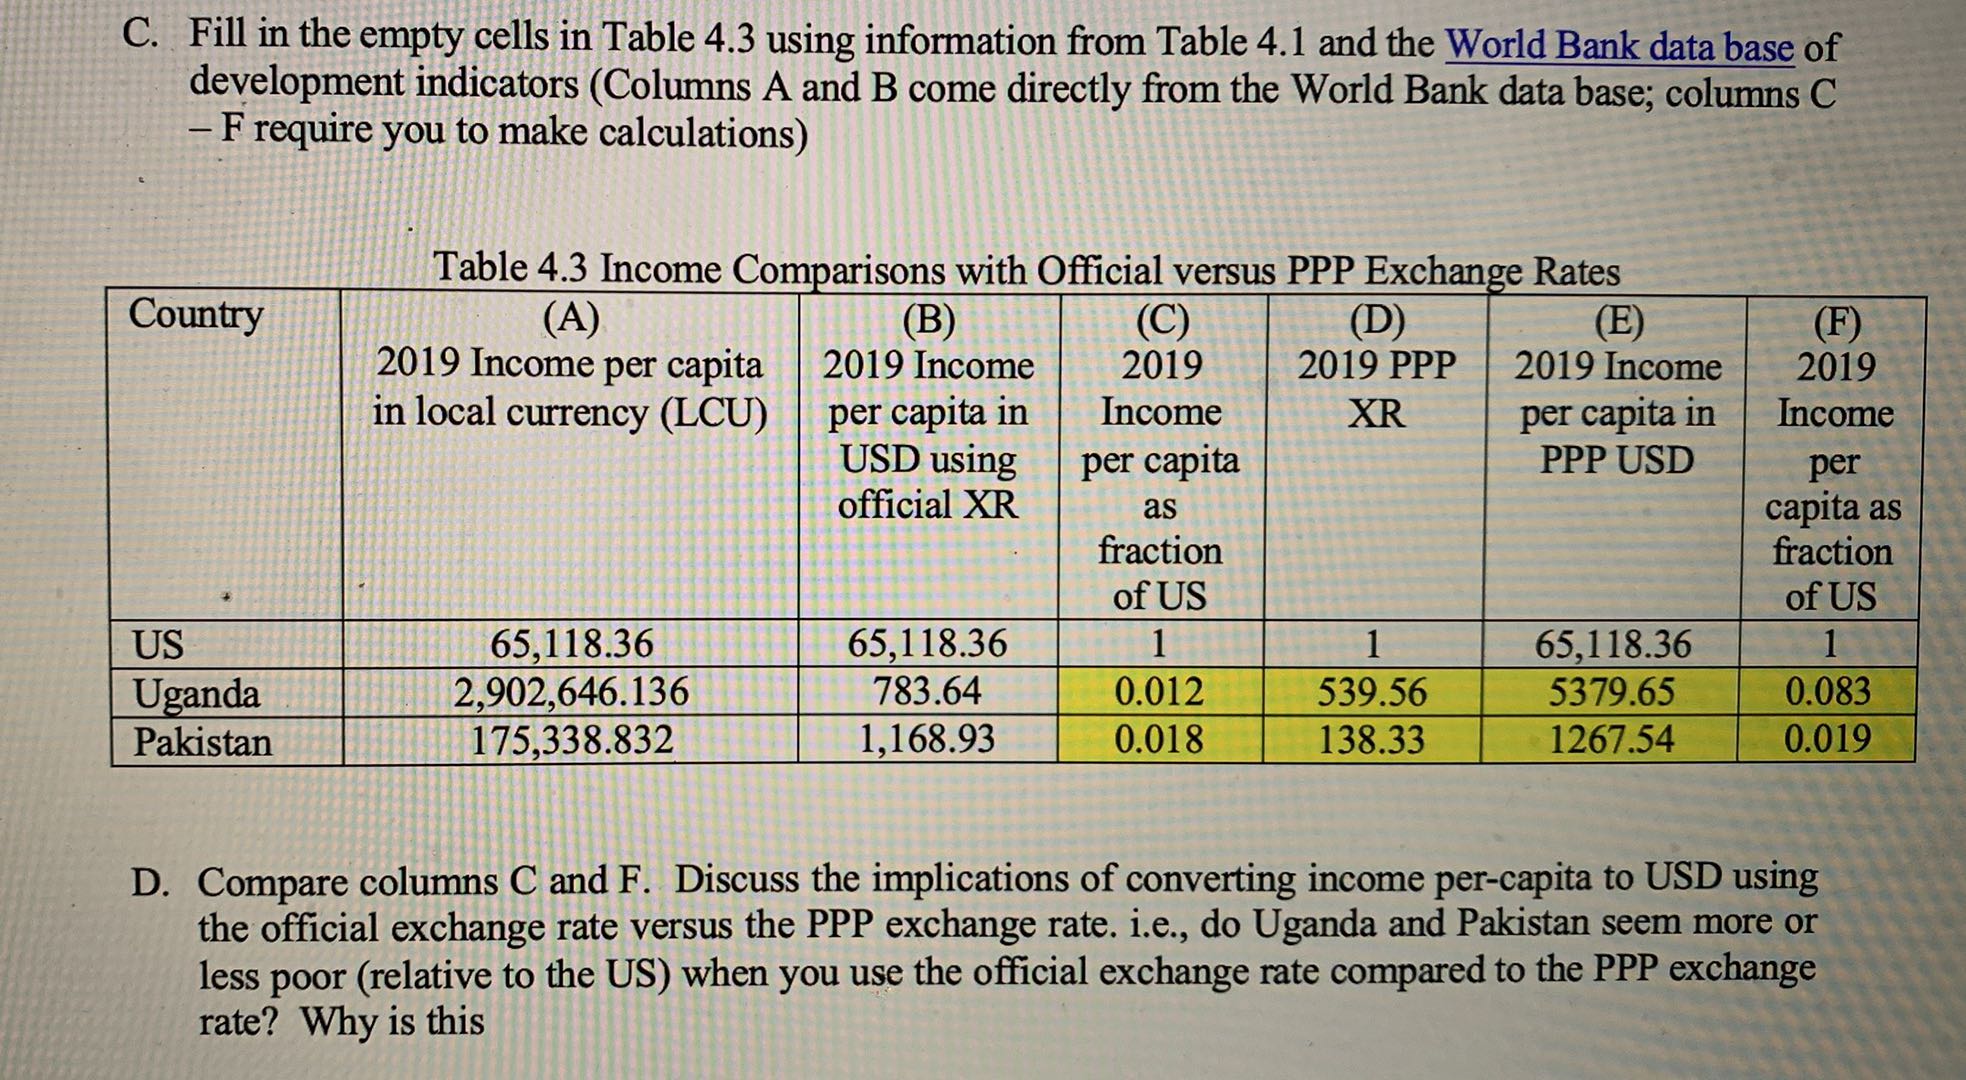
C. Fill in the empty cells in Table 4.3 using information from Table 4.1 and the World Bank data base of development indicators (Columns A and B come directly from the World Bank data base; columns C - F require you to make calculations) Table 4.3 Income Comparisons with Official versus PPP Exchange Rates Country (A) (B) (C) (D (E 2019 Income per capita 2019 Income 2019 2019 PPP 2019 Income 2019 in local currency (LCU) per capita in Income XR per capita in Income USD using per capita PPP USD per official XR as capita as fraction fraction of US of US US 65,118.36 65,118.36 1 65,118.36 1 Uganda 2,902,646.136 783.64 0.012 539.56 5379.65 0.083 Pakistan 175,338.832 1,168.93 0.018 138.33 1267.54 0.019 D. Compare columns C and F. Discuss the implications of converting income per-capita to USD using the official exchange rate versus the PPP exchange rate. i.e., do Uganda and Pakistan seem more or less poor (relative to the US) when you use the official exchange rate compared to the PPP exchange rate? Why is this
Step by Step Solution
There are 3 Steps involved in it

Get step-by-step solutions from verified subject matter experts