

Question: Please answer question d is Nit) here 5? c. . Calculate the following outputs based on information provided in figure 6C with T=1:25; Arrival rate
Please answer question d 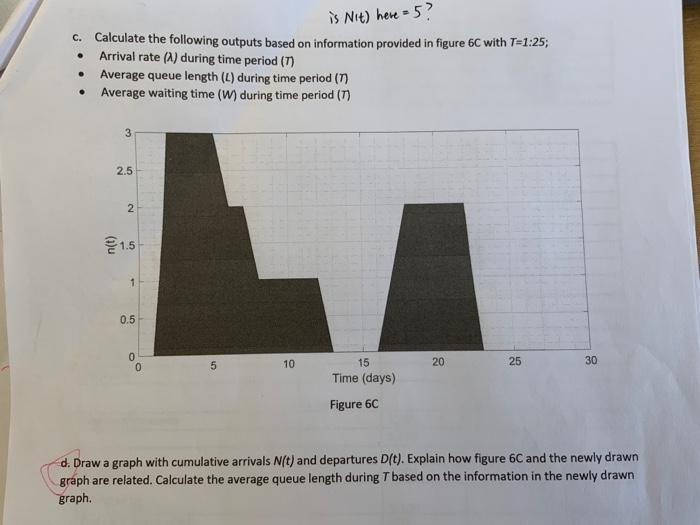
is Nit) here 5? c. . Calculate the following outputs based on information provided in figure 6C with T=1:25; Arrival rate (A) during time period (7) Average queue length (L) during time period in Average waiting time (W) during time period (7) . 3 2.5 2 1.5 1 0.5 0 0 5 10 20 25 30 15 Time (days) Figure 6C d. Draw a graph with cumulative arrivals N(t) and departures D(t). Explain how figure 6C and the newly drawn graph are related. Calculate the average queue length during T based on the information in the newly drawn graph. is Nit) here 5? c. . Calculate the following outputs based on information provided in figure 6C with T=1:25; Arrival rate (A) during time period (7) Average queue length (L) during time period in Average waiting time (W) during time period (7) . 3 2.5 2 1.5 1 0.5 0 0 5 10 20 25 30 15 Time (days) Figure 6C d. Draw a graph with cumulative arrivals N(t) and departures D(t). Explain how figure 6C and the newly drawn graph are related. Calculate the average queue length during T based on the information in the newly drawn graph Step by Step Solution
There are 3 Steps involved in it
1 Expert Approved Answer
Step: 1 Unlock

Question Has Been Solved by an Expert!
Get step-by-step solutions from verified subject matter experts
Step: 2 Unlock
Step: 3 Unlock