

Question: please answer question number 4 from the picture below, i need answer for 4, a, b at Tools Table Window Help Reality Check 3-New (1)
please answer question number 4 from the picture below, i need answer for 4, a, b
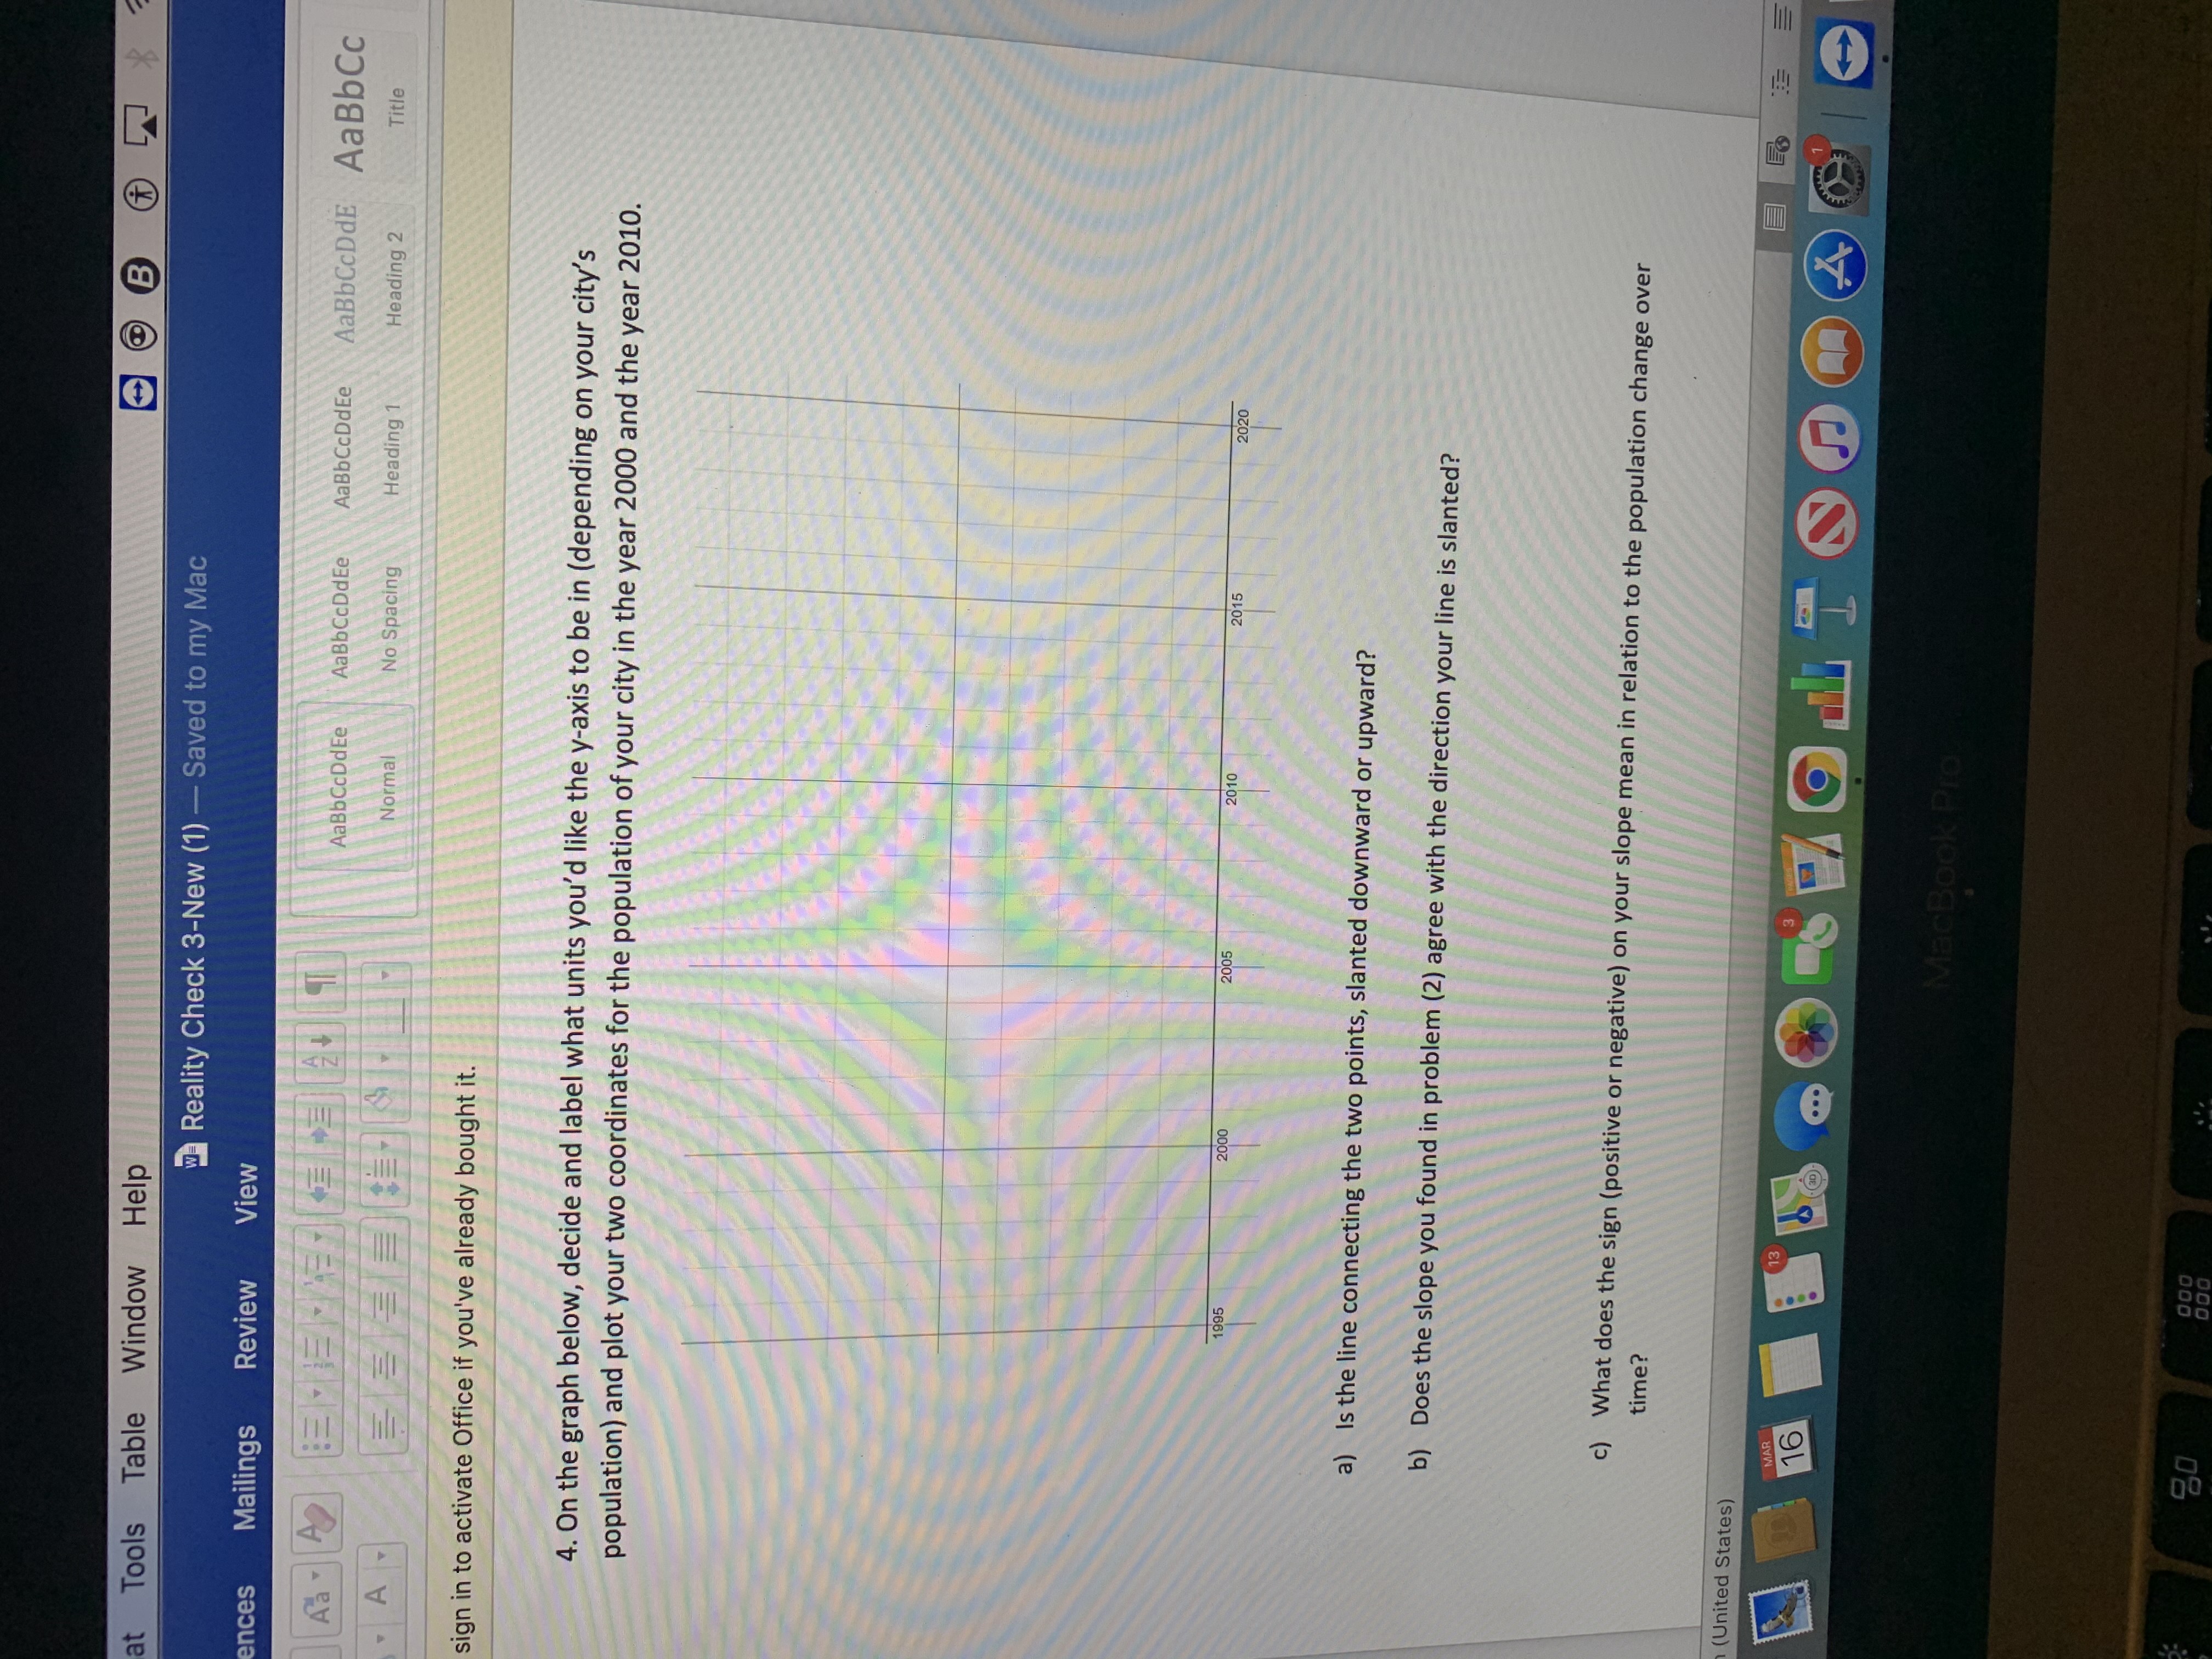
at Tools Table Window Help Reality Check 3-New (1) - Saved to my Mac ences Mailings Review View AaBbCcDdEe AaBbCcDdEe AaBbCcDdEe AaBbCcDdE AaBbCc Normal No Spacing Heading 1 Heading 2 Title sign in to activate Office if you've already bought it. 4. On the graph below, decide and label what units you'd like the y-axis to be in (depending on your city's population) and plot your two coordinates for the population of your city in the year 2000 and the year 2010. 20 00 20 15 2020 a) Is the line connecting the two points, slanted downward or upward? b) Does the slope you found in problem (2) agree with the direction your line is slanted? c) What does the sign (positive or negative) on your slope mean in relation to the population change over time? (United States) MAR 13 16 . .. 4 MacBook Pro 80
Step by Step Solution
There are 3 Steps involved in it

Get step-by-step solutions from verified subject matter experts