

Question: PLEASE ANSWER QUESTION NUMBER 5 & 6 per y Tell m Office Update To keep up-to-date with security updates, fixes, and improvements, choose Check for
PLEASE ANSWER QUESTION NUMBER 5 & 6
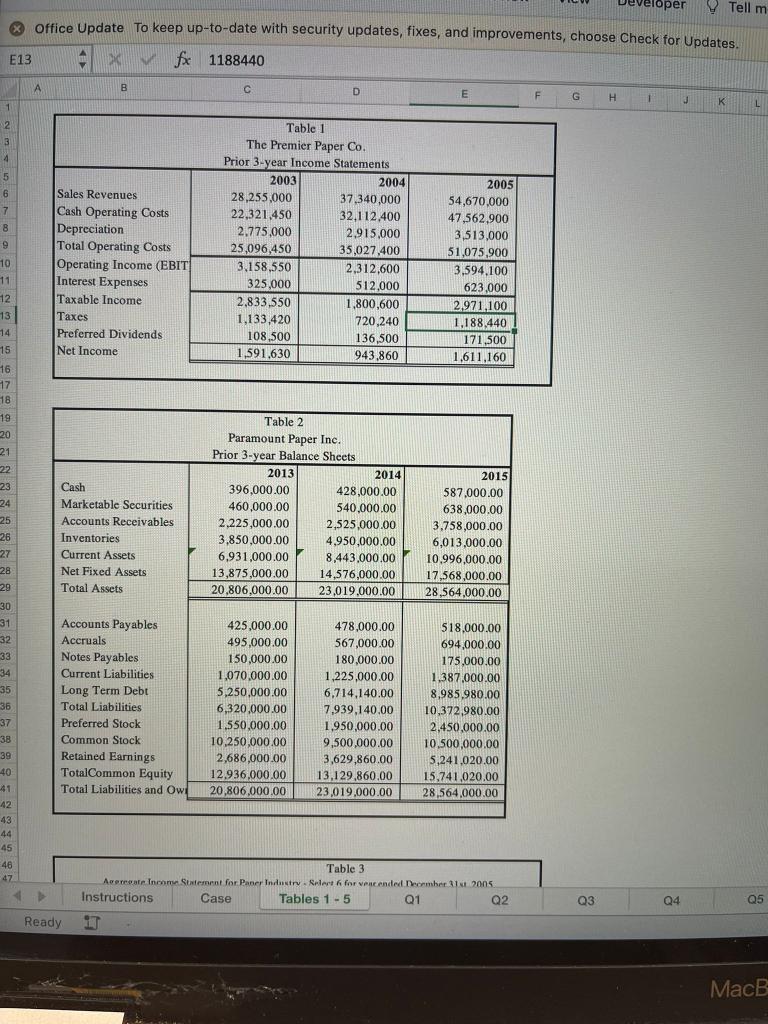
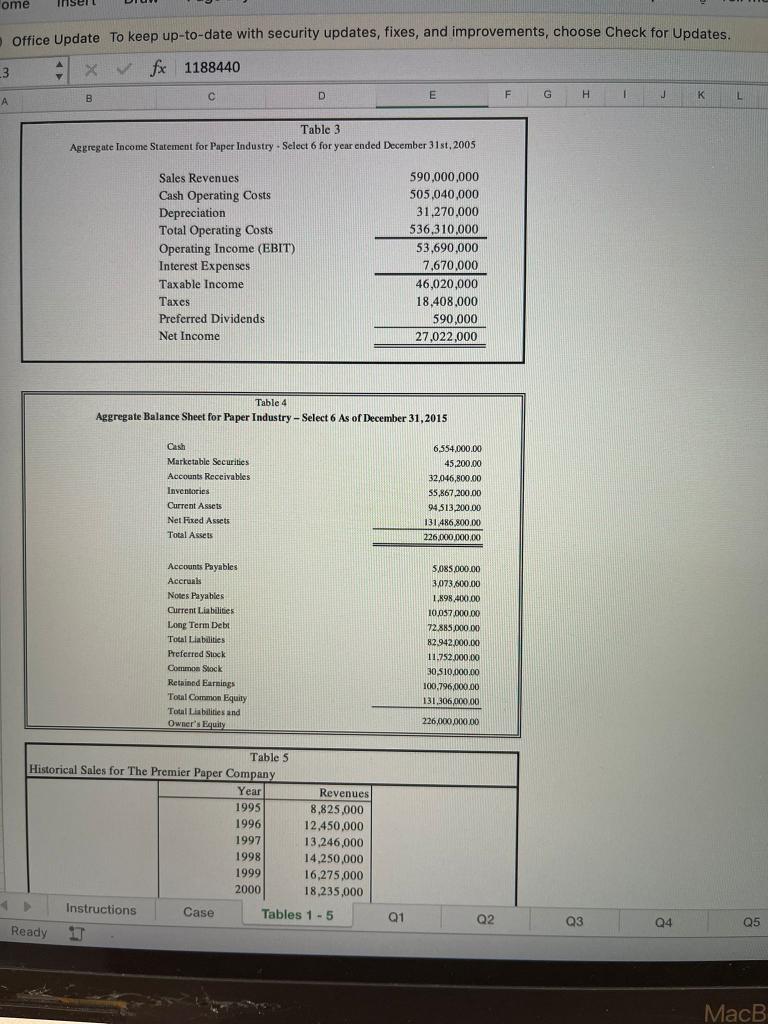
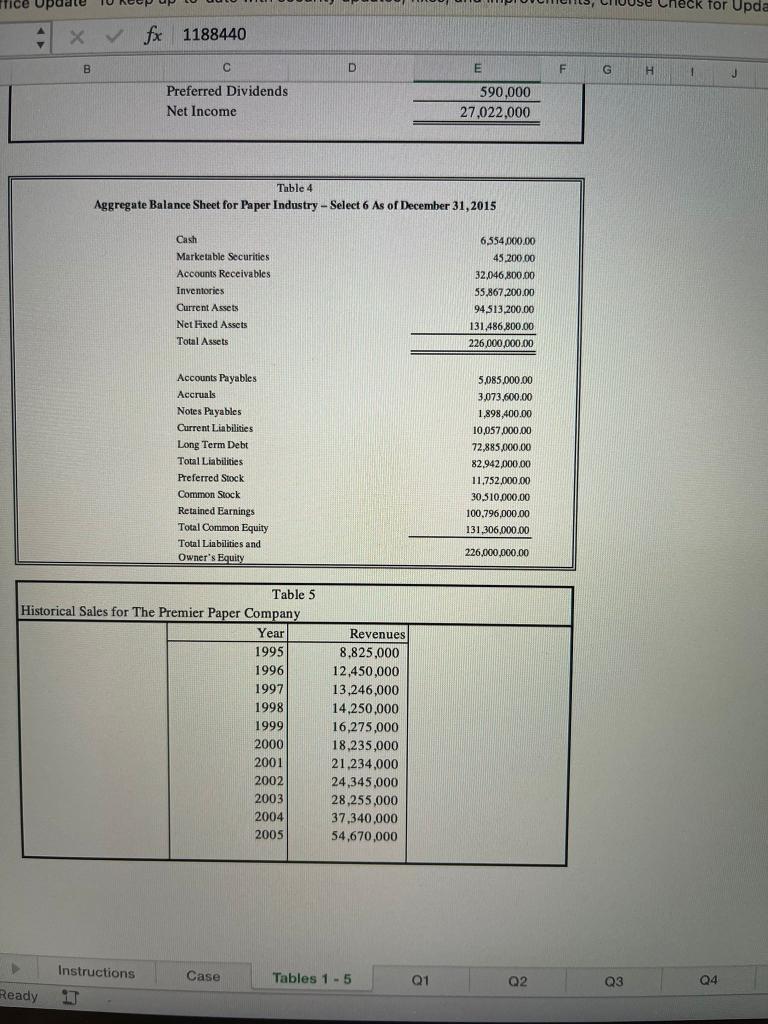
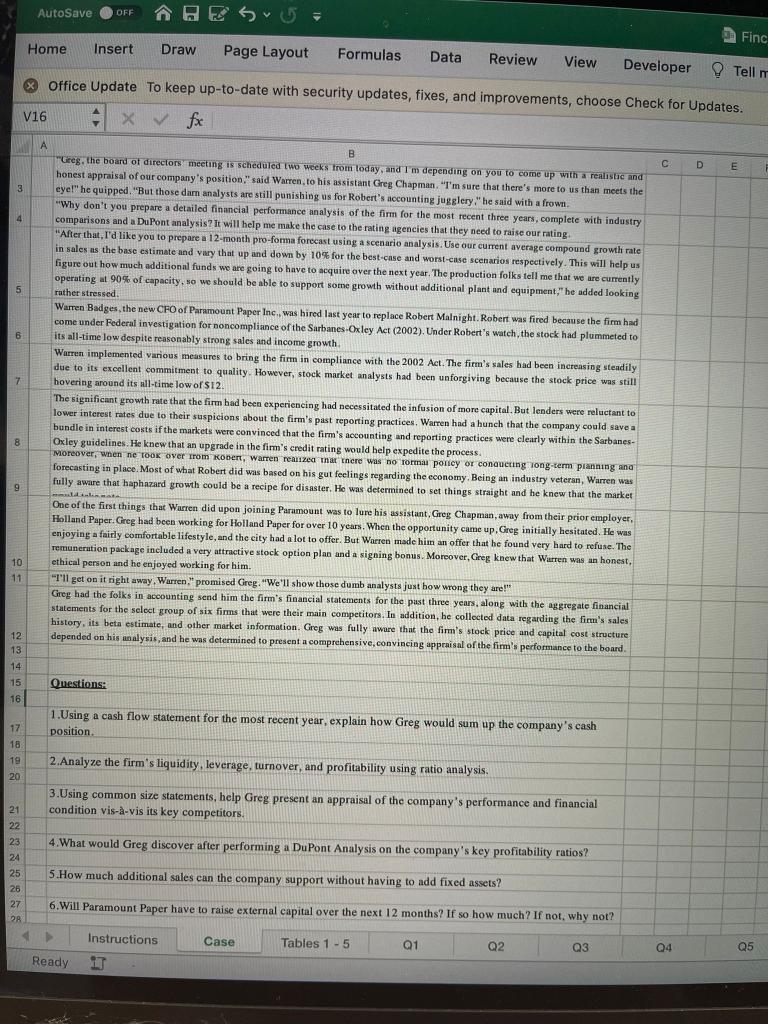
per y Tell m Office Update To keep up-to-date with security updates, fixes, and improvements, choose Check for Updates. E13 XV fe 1188440 A B D E E F G H 1 K 1 1 L 2 3 4 4 5 5 6 6 7 8 9 Table 1 The Premier Paper Co. Prior 3-year Income Statements 2003 2004 28,255,000 37.340,000 22.321,450 32.112.400 2.775.000 2.915.000 25,096,450 35,027,400 3,158,550 2,312,600 325,000 512.000 2.833,550 1,800,600 1.133,420 720,240 108,500 136,500 1,591.630 943,860 Sales Revenues Cash Operating Costs Depreciation Total Operating Costs Operating Income (EBIT Interest Expenses Taxable Income Taxes Preferred Dividends Net Income 10 11 12 13 14 15 2005 54,670,000 47,562.900 3,513,000 51,075,900 3.594,100 623.000 2,971,100 1.188.440 171,500 1,611,160 16 17 18 Bo 19 20 21 22 23 24 25 26 27 28 29 Cash Marketable Securities Accounts Receivables Inventories Current Assets Net Fixed Assets Total Assets Table 2 Paramount Paper Inc. Prior 3-year Balance Sheets 2013 2014 396,000.00 428,000.00 460,000.00 540,000.00 2.225,000.00 2,525,000.00 3,850,000.00 4,950,000.00 6,931,000.00 8,443,000.00 13,875,000.00 14,576,000.00 20,806,000.00 23.019.000.00 2015 587,000.00 638,000.00 3.758,000.00 6.013,000.00 10.996,000.00 17,568,000,00 28,564,000.00 30 31 32 33 34 35 36 37 Accounts Payables Accruals Notes Payables Current Liabilities Long Term Debt Total Liabilities Preferred Stock Common Stock Retained Earnings TotalCommon Equity Total Liabilities and Owi 425,000.00 495,000.00 150,000.00 1,070,000.00 5,250,000.00 6,320,000.00 1.550,000.00 10,250,000.00 2,686,000.00 12,936,000.00 20,806,000.00 478,000.00 567,000.00 180,000.00 1,225,000.00 6,714,140.00 7,939.140.00 1,950,000.00 9,500,000.00 3,629,860.00 13,129,860.00 23.019,000.00 518,000.00 694,000.00 175,000.00 1,387,000.00 8,985,980.00 10,372,980.00 2.450,000.00 10.500,000.00 5,241,020.00 15.741,020,00 28,564,000.00 38 39 40 41 42 43 44 45 46 47 Table 3 Acercate Incon Statement for Paper Industrv. Selert 6 for vencended December 2005 Instructions Case Tables 1 - 5 Q1 Q2 Ready 17 Q3 Q4 Q5 MacB ome Inser Office Update To keep up-to-date with security updates, fixes, and improvements, choose Check for Updates. 3 fx 1188440 B B D E F F G H 1 J K A L Table 3 Aggregate Income Statement for Paper Industry. Select 6 for year ended December 31st, 2005 Sales Revenues Cash Operating Costs Depreciation Total Operating Costs Operating Income (EBIT) Interest Expenses Taxable income Taxes Preferred Dividends Net Income 590,000,000 505,040,000 31,270,000 536,310,000 53,690,000 7.670,000 46,020,000 18,408,000 590,000 27,022,000 Table 4 Aggregate Balance Sheet for Paper Industry - Select 6 As of December 31, 2015 Cash Marketable Securities Accounts Receivables Inventories 6,554,000.00 45,200.00 32,046,800.00 55,867,200.00 94.513,200.00 131 486,800.00 226.000.000,00 Current Assets Net Fixed Assets Total Assets Accounts Payables Accruals Notes Payables Current Liabilities Long Term Debt Total Liabilities Preferred Stock Common Stock Retained Earnings Total Common Equity Total Liabilities and Owner's Equity 5,085,000.00 3,073,500.00 1,898,400.00 10.037.000.00 72.885.000 DO 82 942.000.00 11.752.000.00 30 $10,000.00 100.796,000.00 131,306,000.00 226.000.000,00 Table 5 Historical Sales for The Premier Paper Company Year Revenues 1995 8,825,000 1996 12.450,000 1997 13,246,000 1998 14,250,000 1999 16,275,000 2000 18,235.000 Instructions Case Tables 1-5 Ready Q1 Q2 Q3 Q4 Q5 MacB Trice Update Check for Upda 4 X fx 1188440 B B C D E F G H 1 J Preferred Dividends Net Income 590,000 27.022.000 Table 4 Aggregate Balance Sheet for Paper Industry - Select 6 As of December 31, 2015 Cash Marketable Securities Accounts Receivables Inventorics Current Assets Net Fixed Assets Total Assets 6554,000.00 45,200.00 32,046,800.00 55,867,200.00 94 513,200.00 131,486,800.00 226,000,000.00 Accounts Payables Accruals Notes Payables Current Liabilities Long Term Debt Total Liabilities Preferred Stock Common Stock Retained Earnings Total Common Equity Total Liabilities and Owner's Equity 5,085.000.00 3,073.600.00 1.898,400.00 10,057,000.00 72,885,000.00 82.942,000.00 11,752,000.00 30,310,000.00 100,796,000.00 131,306,000.00 226,000,000.00 Table 5 Historical Sales for The Premier Paper Company Year 1995 1996 1997 1998 1999 2000 2001 2002 2003 2004 2005 Revenues 8.825.000 12,450,000 13,246,000 14.250.000 16,275,000 18,235,000 21,234.000 24,345,000 28,255,000 37.340,000 54,670,000 Instructions Case Tables 1 - 5 Q1 02 Q3 04 Ready 11 AutoSave OFF Finc Home Insert Draw Page Layout Formulas Data Review View Developer Teilm Office Update To keep up-to-date with security updates, fixes, and improvements, choose Check for Updates. V16 X fx A D D E 3 4 5 6 7 B B "Greg. the board of directors' meeting is scheduled two weeks from today and I m depending on you to come up with a realistic and honest appraisal of our company's position." said Warren, to his assistant Greg Chapman. "I'm sure that there's more to us than meets the eyel he quipped. "But those darn analysts are still punishing us for Robert's accounting jugglery," he said with a frown. "Why don't you prepare a detailed financial performance analysis of the firm for the most recent three years, complete with industry comparisons and a DuPont analysis? It will help me make the case to the rating agencies that they need to raise our rating. "After that, I'd like you to prepare a 12-month pro-forma forecast using a scenario analysis. Use our current average compound growth rate in sales as the base estimate and vary that up and down by 10% for the best-case and worst-case scenarios respectively. This will help us figure out how much additional funds we are going to have to acquire over the next year. The production folks tell me that we are currently operating at 90% of capacity, so we should be able to support some growth without additional plant and equipment," he added looking rather stressed Warren Badges, the new CFO of Paramount Paper Inc., was hired last year to replace Robert Malnight. Robert was fired because the firm had come under Federal investigation for noncompliance of the Sarbanes-Oxley Act (2002). Under Robert's watch the stock had plummeted to its all-time low despite reasonably strong sales and income growth Warren implemented various measures to bring the firm in compliance with the 2002 Act. The firm's sales had been increasing steadily due to its excellent commitment to quality. However, stock market analysts had been unforgiving because the stock price was still hovering around its all-time low of S12 The significant growth rate that the firm had been experiencing had necessitated the infusion of more capital. But lenders were reluctant to lower interest rates due to their suspicions about the firm's past reporting practices, Warren had a hunch that the company could save a bundle in interest costs if the markets were convinced that the firm's accounting and reporting practices were clearly within the Sarbanes- Oxley guidelines. He knew that an upgrade in the firm's credit rating would help expedite the process. Moreover, when ne took over from Robert, Warren realized that there was no ormai poney or conquering long-term planning and forecasting in place. Most of what Robert did was based on his gut feelings regarding the economy. Being an industry veteran, Warren was fully aware that haphazard growth could be a recipe for disaster. He was determined to set things straight and he knew that the market One of the first things that Warren did upon joining Paramount was to lure his assistant. Greg Chapman, away from their prior employer, Holland Paper. Greg had been working for Holland Paper for over 10 years. When the opportunity came up, Greg initially hesitated. He was enjoying a fairly comfortable lifestyle, and the city had a lot to offer. But Warren made him an offer that he found very hard to refuse. The remuneration package included a very attractive stock option plan and a signing bonus. Moreover, Greg knew that Warren was an honest, ethical person and he enjoyed working for him. "I'll get on it right away. Warren." promised Greg. "We'll show those dumb analysts just how wrong they are!" Greg had the folks in accounting send him the firm's financial statements for the past three years, along with the aggregate financial statements for the select group of six firms that were their main competitors. In addition, he collected data regarding the firm's sales history, its beta estimate, and other market information. Greg wis fully aware that the firm's stock price and capital cost structure depended on his analysis, and he was determined to present a comprehensive,convincing appraisal of the firm's performance to the board. 8 9 10 11 12 13 14 15 16 Questions: 17 1.Using a cash flow statement for the most recent year, explain how Greg would sum up the company's cash position 18 19 20 2. Analyze the firm's liquidity, leverage, turnover, and profitability using ratio analysis. 3.Using common size statements, help Greg present an appraisal of the company's performance and financial condition vis--vis its key competitors. 4.What would Greg discover after performing a DuPont Analysis on the company's key profitability ratios? 21 22 23 24 25 26 27 28 5.How much additional sales can the company support without having to add fixed assets? 6. Will Paramount Paper have to raise external capital over the next 12 months? If so how much? If not, why not? Instructions Case Tables 1 - 5 Q1 Q2 Q3 Q4 Q5 Ready 17 per y Tell m Office Update To keep up-to-date with security updates, fixes, and improvements, choose Check for Updates. E13 XV fe 1188440 A B D E E F G H 1 K 1 1 L 2 3 4 4 5 5 6 6 7 8 9 Table 1 The Premier Paper Co. Prior 3-year Income Statements 2003 2004 28,255,000 37.340,000 22.321,450 32.112.400 2.775.000 2.915.000 25,096,450 35,027,400 3,158,550 2,312,600 325,000 512.000 2.833,550 1,800,600 1.133,420 720,240 108,500 136,500 1,591.630 943,860 Sales Revenues Cash Operating Costs Depreciation Total Operating Costs Operating Income (EBIT Interest Expenses Taxable Income Taxes Preferred Dividends Net Income 10 11 12 13 14 15 2005 54,670,000 47,562.900 3,513,000 51,075,900 3.594,100 623.000 2,971,100 1.188.440 171,500 1,611,160 16 17 18 Bo 19 20 21 22 23 24 25 26 27 28 29 Cash Marketable Securities Accounts Receivables Inventories Current Assets Net Fixed Assets Total Assets Table 2 Paramount Paper Inc. Prior 3-year Balance Sheets 2013 2014 396,000.00 428,000.00 460,000.00 540,000.00 2.225,000.00 2,525,000.00 3,850,000.00 4,950,000.00 6,931,000.00 8,443,000.00 13,875,000.00 14,576,000.00 20,806,000.00 23.019.000.00 2015 587,000.00 638,000.00 3.758,000.00 6.013,000.00 10.996,000.00 17,568,000,00 28,564,000.00 30 31 32 33 34 35 36 37 Accounts Payables Accruals Notes Payables Current Liabilities Long Term Debt Total Liabilities Preferred Stock Common Stock Retained Earnings TotalCommon Equity Total Liabilities and Owi 425,000.00 495,000.00 150,000.00 1,070,000.00 5,250,000.00 6,320,000.00 1.550,000.00 10,250,000.00 2,686,000.00 12,936,000.00 20,806,000.00 478,000.00 567,000.00 180,000.00 1,225,000.00 6,714,140.00 7,939.140.00 1,950,000.00 9,500,000.00 3,629,860.00 13,129,860.00 23.019,000.00 518,000.00 694,000.00 175,000.00 1,387,000.00 8,985,980.00 10,372,980.00 2.450,000.00 10.500,000.00 5,241,020.00 15.741,020,00 28,564,000.00 38 39 40 41 42 43 44 45 46 47 Table 3 Acercate Incon Statement for Paper Industrv. Selert 6 for vencended December 2005 Instructions Case Tables 1 - 5 Q1 Q2 Ready 17 Q3 Q4 Q5 MacB ome Inser Office Update To keep up-to-date with security updates, fixes, and improvements, choose Check for Updates. 3 fx 1188440 B B D E F F G H 1 J K A L Table 3 Aggregate Income Statement for Paper Industry. Select 6 for year ended December 31st, 2005 Sales Revenues Cash Operating Costs Depreciation Total Operating Costs Operating Income (EBIT) Interest Expenses Taxable income Taxes Preferred Dividends Net Income 590,000,000 505,040,000 31,270,000 536,310,000 53,690,000 7.670,000 46,020,000 18,408,000 590,000 27,022,000 Table 4 Aggregate Balance Sheet for Paper Industry - Select 6 As of December 31, 2015 Cash Marketable Securities Accounts Receivables Inventories 6,554,000.00 45,200.00 32,046,800.00 55,867,200.00 94.513,200.00 131 486,800.00 226.000.000,00 Current Assets Net Fixed Assets Total Assets Accounts Payables Accruals Notes Payables Current Liabilities Long Term Debt Total Liabilities Preferred Stock Common Stock Retained Earnings Total Common Equity Total Liabilities and Owner's Equity 5,085,000.00 3,073,500.00 1,898,400.00 10.037.000.00 72.885.000 DO 82 942.000.00 11.752.000.00 30 $10,000.00 100.796,000.00 131,306,000.00 226.000.000,00 Table 5 Historical Sales for The Premier Paper Company Year Revenues 1995 8,825,000 1996 12.450,000 1997 13,246,000 1998 14,250,000 1999 16,275,000 2000 18,235.000 Instructions Case Tables 1-5 Ready Q1 Q2 Q3 Q4 Q5 MacB Trice Update Check for Upda 4 X fx 1188440 B B C D E F G H 1 J Preferred Dividends Net Income 590,000 27.022.000 Table 4 Aggregate Balance Sheet for Paper Industry - Select 6 As of December 31, 2015 Cash Marketable Securities Accounts Receivables Inventorics Current Assets Net Fixed Assets Total Assets 6554,000.00 45,200.00 32,046,800.00 55,867,200.00 94 513,200.00 131,486,800.00 226,000,000.00 Accounts Payables Accruals Notes Payables Current Liabilities Long Term Debt Total Liabilities Preferred Stock Common Stock Retained Earnings Total Common Equity Total Liabilities and Owner's Equity 5,085.000.00 3,073.600.00 1.898,400.00 10,057,000.00 72,885,000.00 82.942,000.00 11,752,000.00 30,310,000.00 100,796,000.00 131,306,000.00 226,000,000.00 Table 5 Historical Sales for The Premier Paper Company Year 1995 1996 1997 1998 1999 2000 2001 2002 2003 2004 2005 Revenues 8.825.000 12,450,000 13,246,000 14.250.000 16,275,000 18,235,000 21,234.000 24,345,000 28,255,000 37.340,000 54,670,000 Instructions Case Tables 1 - 5 Q1 02 Q3 04 Ready 11 AutoSave OFF Finc Home Insert Draw Page Layout Formulas Data Review View Developer Teilm Office Update To keep up-to-date with security updates, fixes, and improvements, choose Check for Updates. V16 X fx A D D E 3 4 5 6 7 B B "Greg. the board of directors' meeting is scheduled two weeks from today and I m depending on you to come up with a realistic and honest appraisal of our company's position." said Warren, to his assistant Greg Chapman. "I'm sure that there's more to us than meets the eyel he quipped. "But those darn analysts are still punishing us for Robert's accounting jugglery," he said with a frown. "Why don't you prepare a detailed financial performance analysis of the firm for the most recent three years, complete with industry comparisons and a DuPont analysis? It will help me make the case to the rating agencies that they need to raise our rating. "After that, I'd like you to prepare a 12-month pro-forma forecast using a scenario analysis. Use our current average compound growth rate in sales as the base estimate and vary that up and down by 10% for the best-case and worst-case scenarios respectively. This will help us figure out how much additional funds we are going to have to acquire over the next year. The production folks tell me that we are currently operating at 90% of capacity, so we should be able to support some growth without additional plant and equipment," he added looking rather stressed Warren Badges, the new CFO of Paramount Paper Inc., was hired last year to replace Robert Malnight. Robert was fired because the firm had come under Federal investigation for noncompliance of the Sarbanes-Oxley Act (2002). Under Robert's watch the stock had plummeted to its all-time low despite reasonably strong sales and income growth Warren implemented various measures to bring the firm in compliance with the 2002 Act. The firm's sales had been increasing steadily due to its excellent commitment to quality. However, stock market analysts had been unforgiving because the stock price was still hovering around its all-time low of S12 The significant growth rate that the firm had been experiencing had necessitated the infusion of more capital. But lenders were reluctant to lower interest rates due to their suspicions about the firm's past reporting practices, Warren had a hunch that the company could save a bundle in interest costs if the markets were convinced that the firm's accounting and reporting practices were clearly within the Sarbanes- Oxley guidelines. He knew that an upgrade in the firm's credit rating would help expedite the process. Moreover, when ne took over from Robert, Warren realized that there was no ormai poney or conquering long-term planning and forecasting in place. Most of what Robert did was based on his gut feelings regarding the economy. Being an industry veteran, Warren was fully aware that haphazard growth could be a recipe for disaster. He was determined to set things straight and he knew that the market One of the first things that Warren did upon joining Paramount was to lure his assistant. Greg Chapman, away from their prior employer, Holland Paper. Greg had been working for Holland Paper for over 10 years. When the opportunity came up, Greg initially hesitated. He was enjoying a fairly comfortable lifestyle, and the city had a lot to offer. But Warren made him an offer that he found very hard to refuse. The remuneration package included a very attractive stock option plan and a signing bonus. Moreover, Greg knew that Warren was an honest, ethical person and he enjoyed working for him. "I'll get on it right away. Warren." promised Greg. "We'll show those dumb analysts just how wrong they are!" Greg had the folks in accounting send him the firm's financial statements for the past three years, along with the aggregate financial statements for the select group of six firms that were their main competitors. In addition, he collected data regarding the firm's sales history, its beta estimate, and other market information. Greg wis fully aware that the firm's stock price and capital cost structure depended on his analysis, and he was determined to present a comprehensive,convincing appraisal of the firm's performance to the board. 8 9 10 11 12 13 14 15 16 Questions: 17 1.Using a cash flow statement for the most recent year, explain how Greg would sum up the company's cash position 18 19 20 2. Analyze the firm's liquidity, leverage, turnover, and profitability using ratio analysis. 3.Using common size statements, help Greg present an appraisal of the company's performance and financial condition vis--vis its key competitors. 4.What would Greg discover after performing a DuPont Analysis on the company's key profitability ratios? 21 22 23 24 25 26 27 28 5.How much additional sales can the company support without having to add fixed assets? 6. Will Paramount Paper have to raise external capital over the next 12 months? If so how much? If not, why not? Instructions Case Tables 1 - 5 Q1 Q2 Q3 Q4 Q5 Ready 17
Step by Step Solution
There are 3 Steps involved in it

Get step-by-step solutions from verified subject matter experts