

Question: Please answer question. Q5) Interpret the following. What do you learn? What conclusions can you draw? Don't forget to write your answers in the spreadsheet
Please answer question.
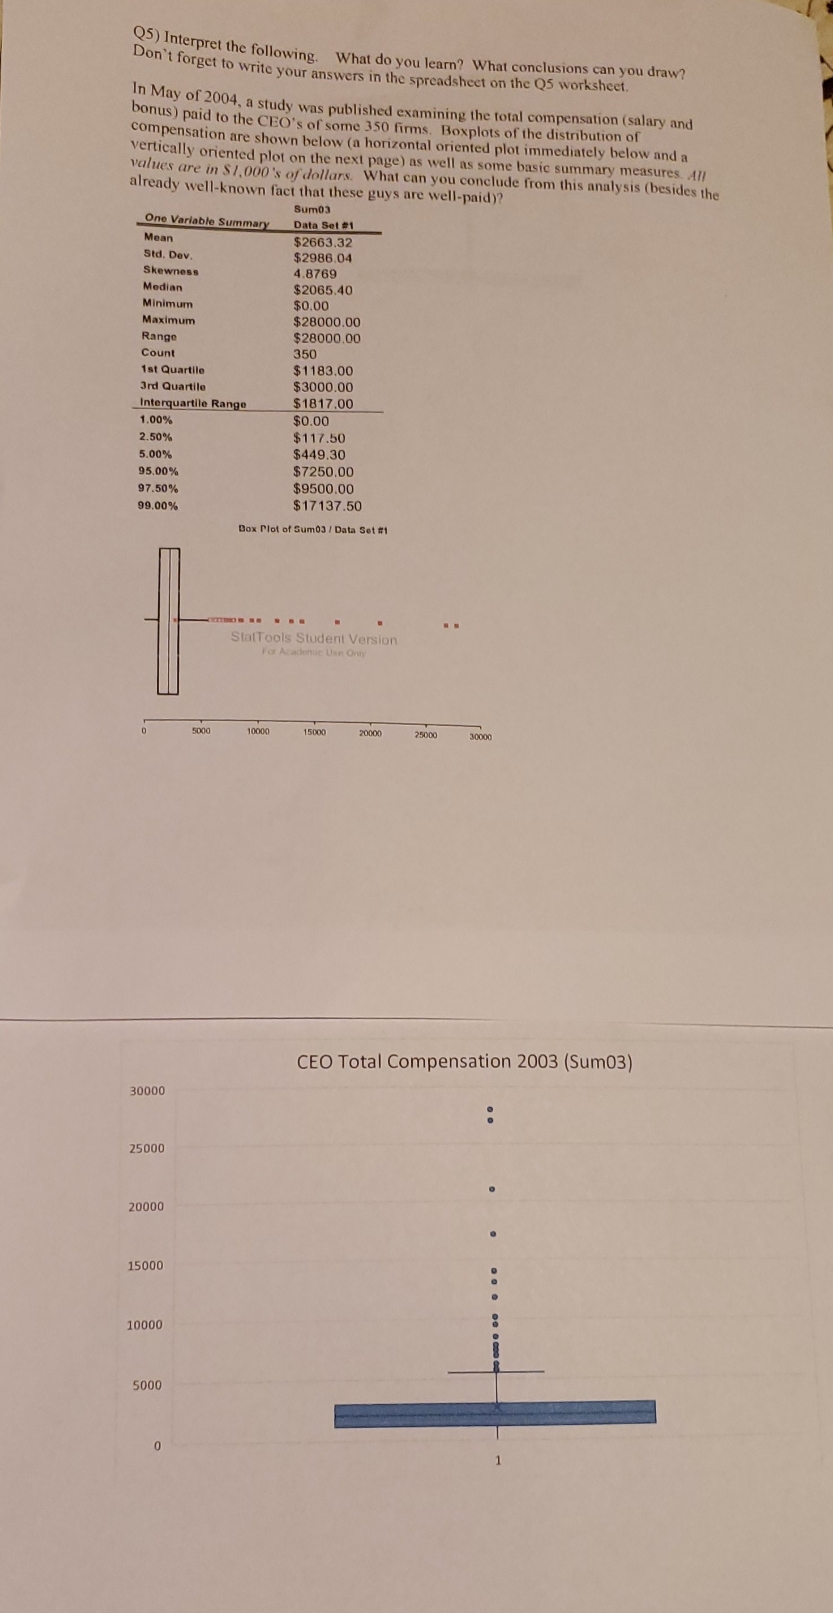
Q5) Interpret the following. What do you learn? What conclusions can you draw? Don't forget to write your answers in the spreadsheet on the Q5 worksheet. In May of 2004, a study was published examining the total compensation (salary and bonus) paid to the CEO's of some 350 firms. Boxplots of the distribution of compensation are shown below (a horizontal oriented plot immediately below and a vertically oriented plot on the next page) as well as some basic summary measures. All values are in $1.000's of dollars. What can you conclude from this analysis (besides the already well-known fact that these guys are well-paid)? Sum03 One Variable Summary Data Set #1 Mean $2663.32 Std. Dev. $2986.04 Skewness 4.8769 Median $2065.40 Minimum $0.00 Maximum $28000.00 Range $28000.00 Count 350 1st Quartile $1183.00 3rd Quartile $3000.00 Interquartile Range $1817.00 1.00% $0.00 2.50% $117.50 5.00% $449.30 95.00% $7250.00 97.50% $9500.00 99.00% $17137.50 Dox Plot of Sum03 / Data Set #1 StatTools Student Version For Academic Use Only 5000 10000 15000 20000 25000 30000 CEO Total Compensation 2003 (Sum03) 30000 25000 . 20000 . 15000 10000 5000
Step by Step Solution
There are 3 Steps involved in it

Get step-by-step solutions from verified subject matter experts