

Question: Please answer question using excel functions with in cell viewing. Problem Three (15 marks) You work for a large investment management firm. The analysts with
Please answer question using excel functions with in cell viewing.
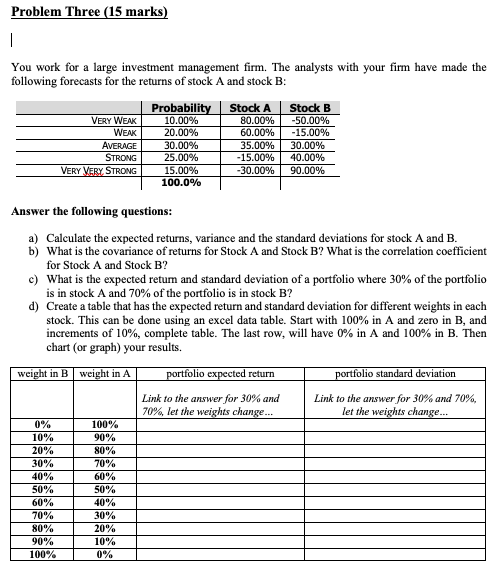
Problem Three (15 marks) You work for a large investment management firm. The analysts with your firm have made the following forecasts for the returns of stock A and stock E Probabili 10.00% 20.00% 30.00% 25.00% 15.00% 100.0% Stock A Stock B VERY WEAK WEAK AVERAGE STRONG 60.00% 25.00% | 15.00% | 30.00% | -15.00% 30.00% 40.00% 90.00% VERY Answer the following questions a) Calculate the expected returns, variance and the standard deviations for stock A and B b) What is the covariance of returns for Stock A and Stock B? What is the correlation coefficient c) What is the expected retum and standard deviation of a portfolio where 30% of the portfolio d) Create a table that has the expected return and standard deviation for different weights in each for Stock A and Stock B? is in stock A and 70% of the portfolio is in stock B? stock. This can be done using an excel data table. Start with 100% in A and zero in B, and increments of 10%, complete table. The last row, will have 0% in A and 100% in B. Then chart (or graph) your results. weight in B weight in A rtfolio expected return folio standard deviation Link to the answer for 30% and 70%, let the Link to the answer for 30% and 70%. chan et the ts chan 0% 10% 20% 30% 40% 50% 60% 70% 80% 90% 100% 100% 90% 80% 70% 60% 50% 40% 30% 20% 10% 0%
Step by Step Solution
There are 3 Steps involved in it

Get step-by-step solutions from verified subject matter experts