

Question: Please answer question. You just started a new job as a Finance Manager at XYZ Corp. As you are starting to get acquainted with the
 Please answer question.
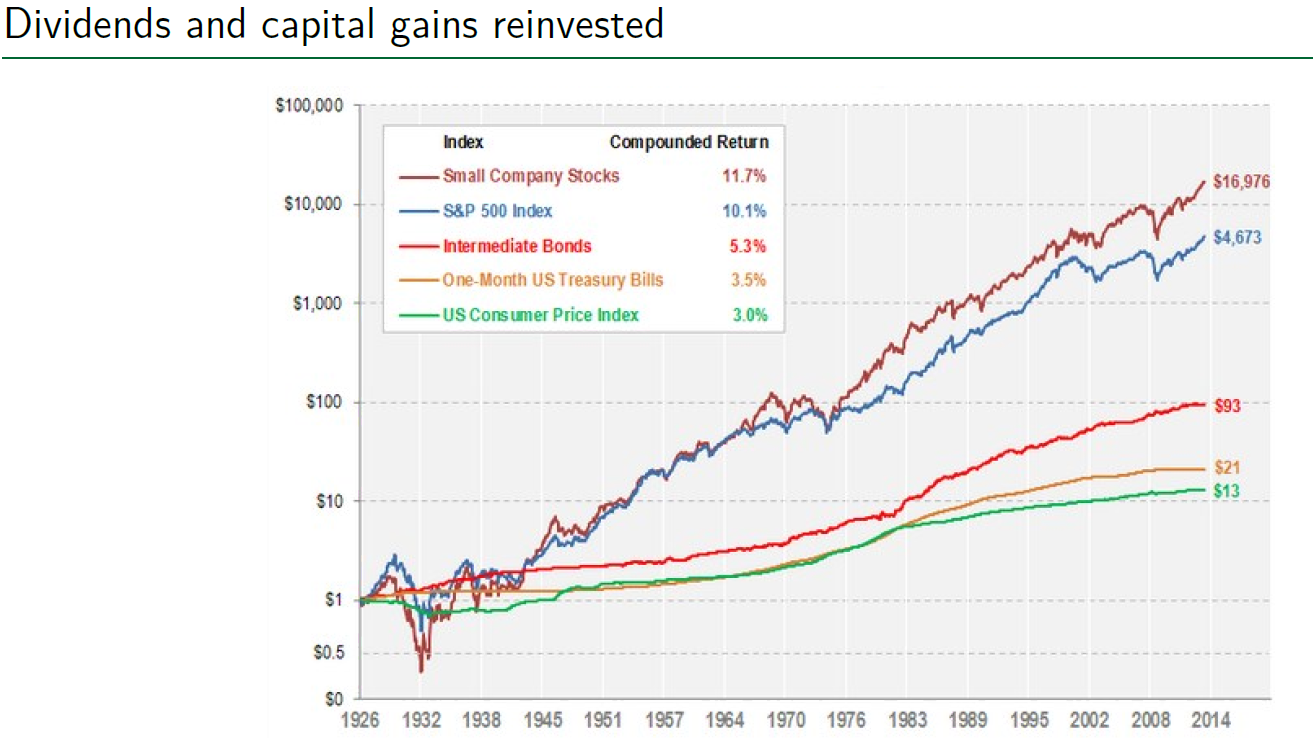
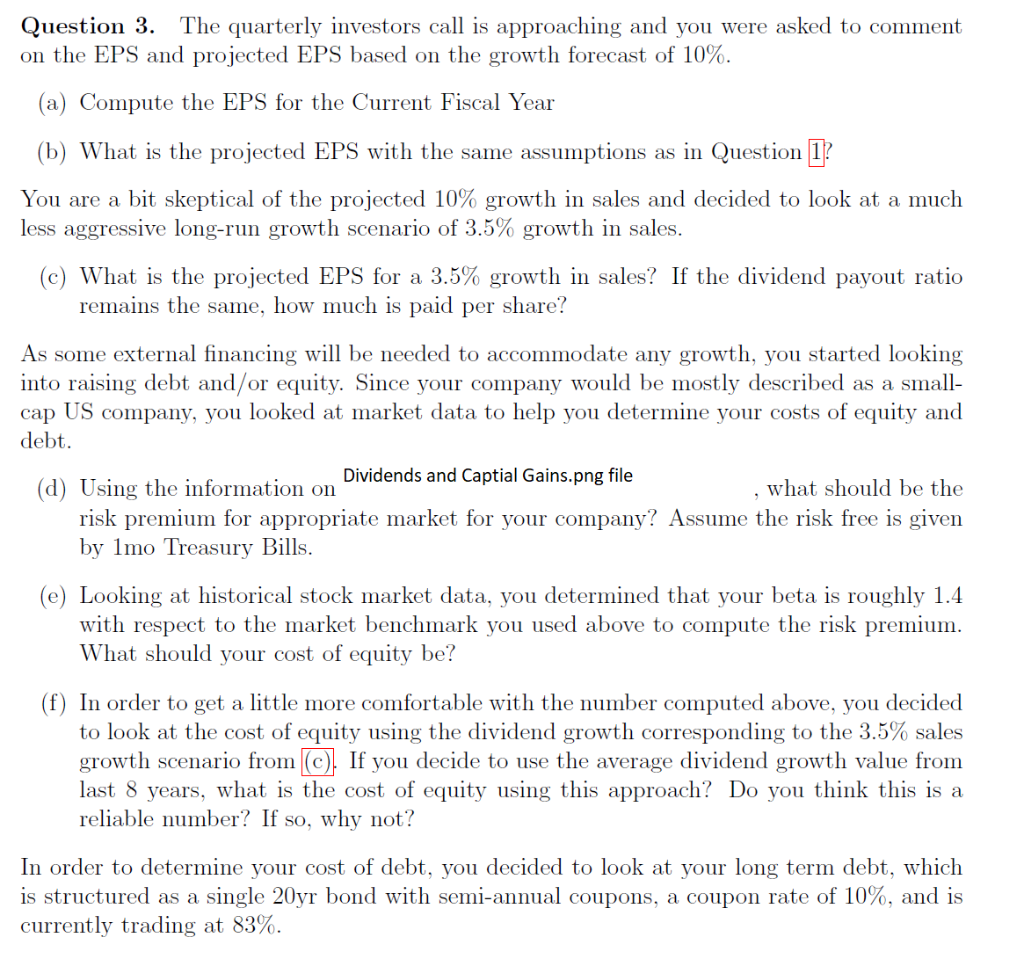
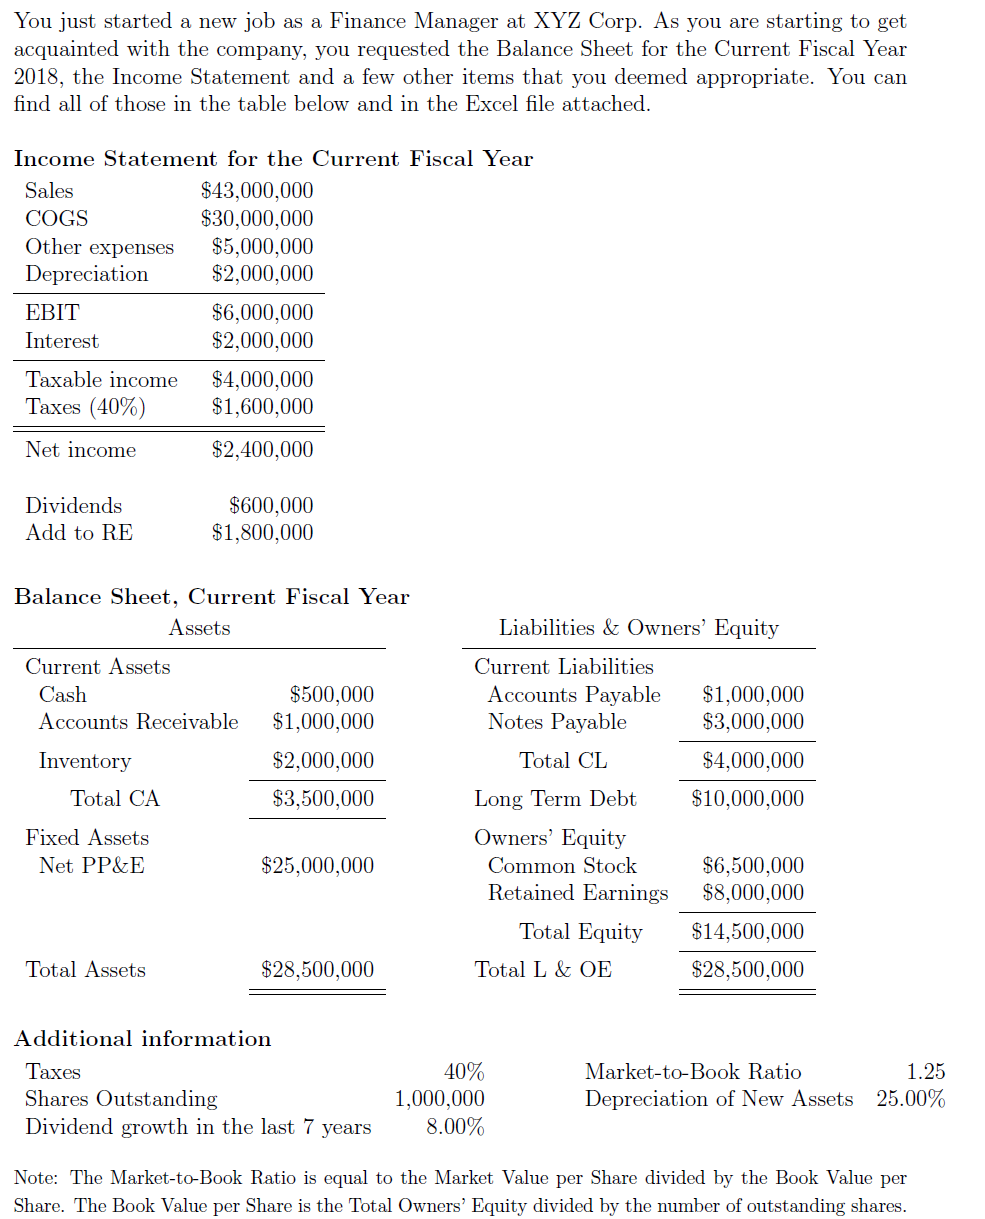
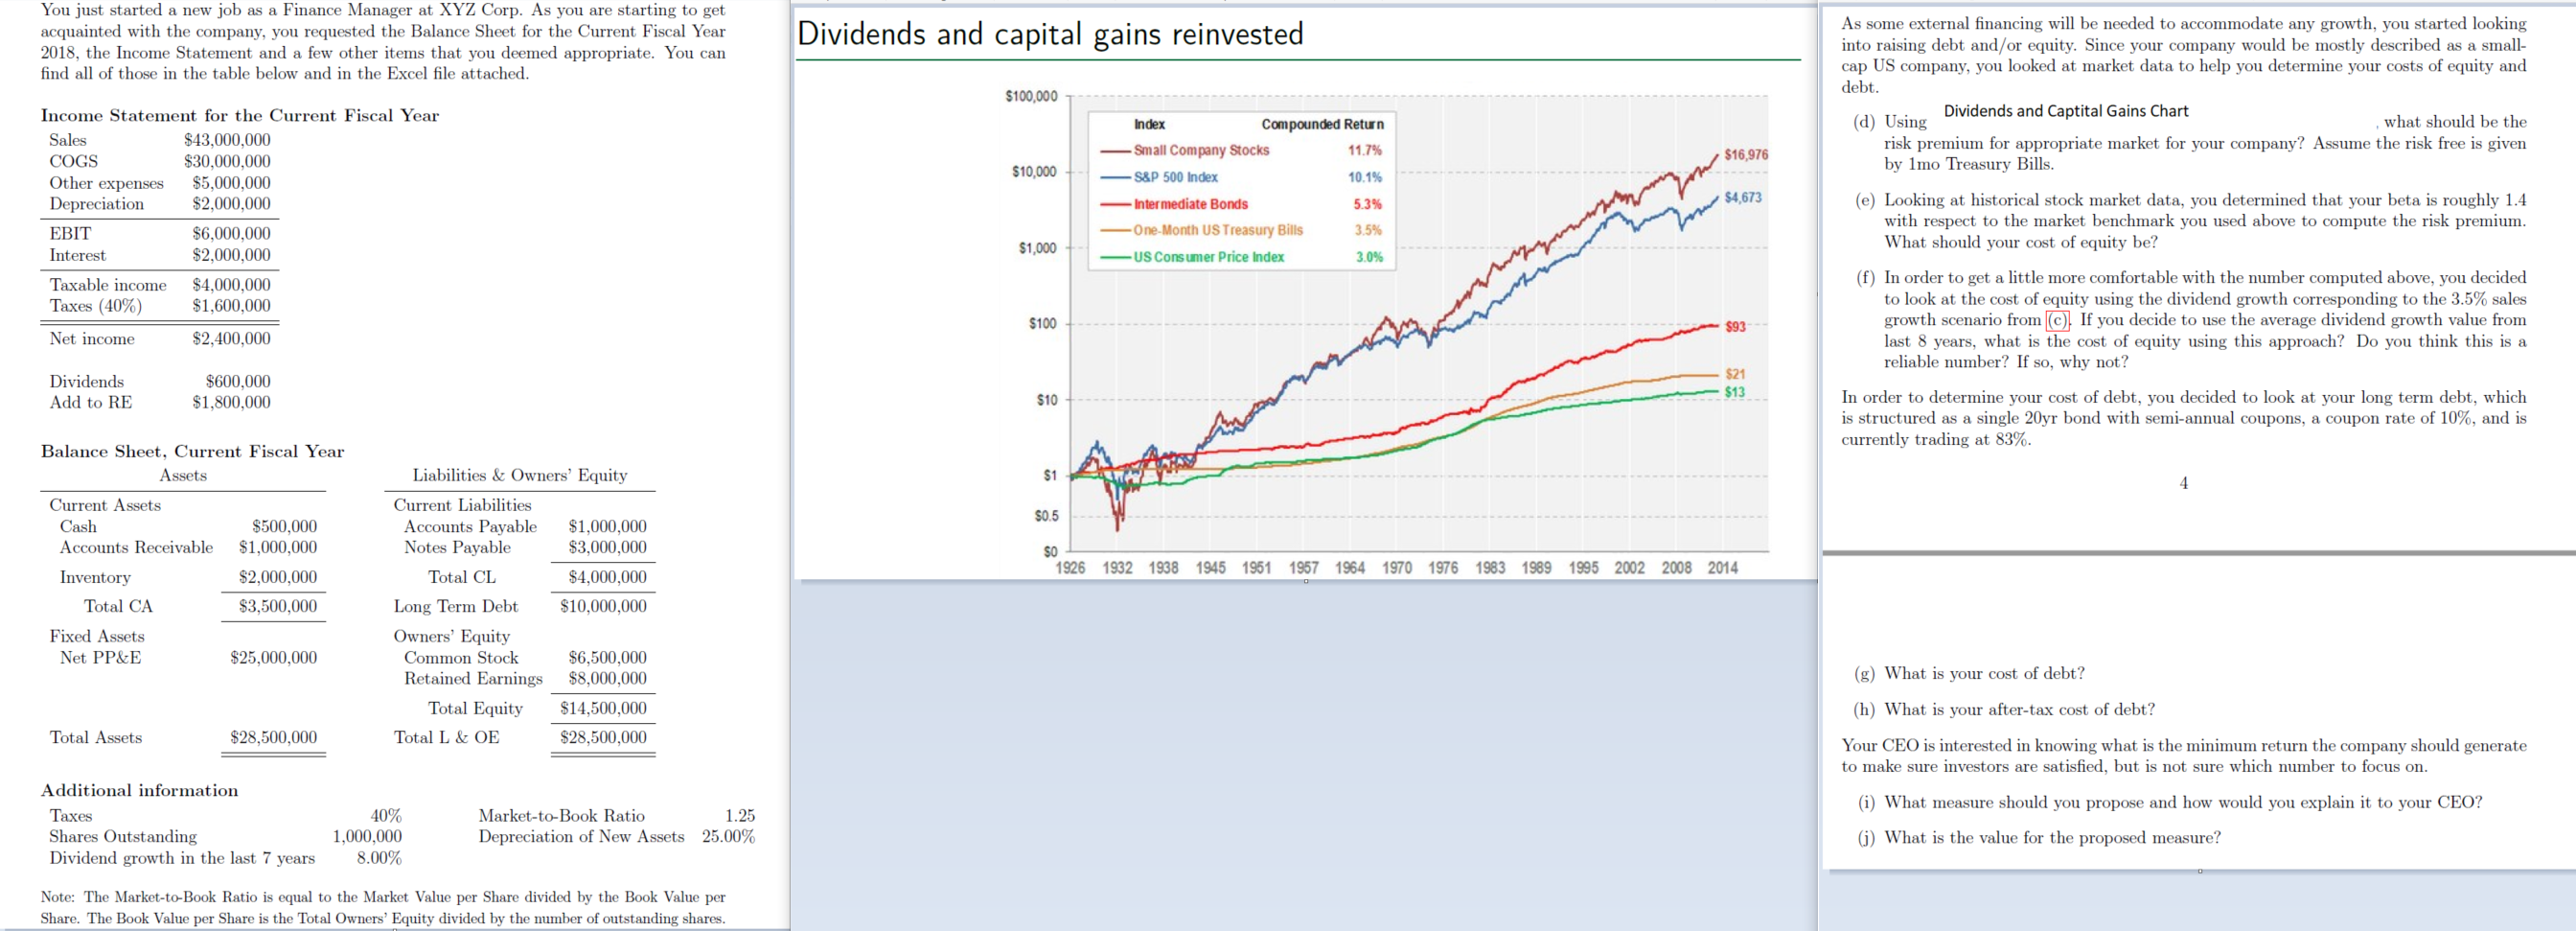
You just started a new job as a Finance Manager at XYZ Corp. As you are starting to get acquainted with the company, you requested the Balance Sheet for the Current Fiscal Year 2018, the Income Statement and a few other items that you deemed appropriate. You can find all of those in the table below and in the Excel file attached. Dividends and capital gains reinvested $100,000 As some external financing will be needed to accommodate any growth, you started looking into raising debt and/or equity. Since your company would be mostly described as a small- cap US company, you looked at market data to help you determine your costs of equity and debt. Dividends and Captital Gains Chart (d) Using what should be the risk premium for appropriate market for your company? Assume the risk free is given by 1mo Treasury Bills. Index $16,976 $10,000 Compounded Return Small Company Stocks 11.7% S&P 500 Index 10.1% Intermediate Bonds 5.3% -One-Month US Treasury Bills 3.5% -US Consumer Price Index 3.0% 54,673 Income Statement for the Current Fiscal Year Sales $43,000,000 COGS $30,000,000 Other expenses $5,000,000 Depreciation $2,000,000 EBIT $6,000,000 Interest $2,000,000 Taxable income $4,000,000 Taxes (40%) $1,600,000 Net income $2,400,000 $1,000 (e) Looking at historical stock market data, you determined that your beta is roughly 1.4 with respect to the market benchmark you used above to compute the risk premium. What should your cost of equity be? (f) In order to get a little more comfortable with the number computed above, you decided to look at the cost of equity using the dividend growth corresponding to the 3.5% sales growth scenario from ). If you decide to use the average dividend growth value from last 8 years, what is the cost of equity using this approach? Do you think this is a reliable number? If so, why not? $100 $93 Dividends Add to RE $600,000 $1,800,000 $21 $13 $10 In order to determine your cost of debt, you decided to look at your long term debt, which is structured as a single 20yr bond with semi-annual coupons, a coupon rate of 10%, and is currently trading at 83%. Balance Sheet, Current Fiscal Year Assets $1 4 $0.5 Current Assets Cash Accounts Receivable $500,000 $1,000,000 SO 1926 1932 1938 1945 1951 1957 1964 1970 1976 1983 1989 1995 2002 2008 2014 Inventory Total CA $2,000,000 $3,500,000 Liabilities & Owners' Equity Current Liabilities Accounts Payable $1,000,000 Notes Payable $3,000,000 Total CL $4,000,000 Long Term Debt $10,000,000 Owners' Equity Common Stock $6,500,000 Retained Earnings $8,000,000 Total Equity $14,500,000 Total L & OE $28,500,000 Fixed Assets Net PP&E $25,000,000 (g) What is your cost of debt? (h) What is your after-tax cost of debt? Total Assets $28,500,000 Your CEO is interested in knowing what is the minimum return the company should generate to make sure investors are satisfied, but is not sure which number to focus on. (i) What measure should you propose and how would you explain it to your CEO? Additional information Taxes Shares Outstanding Dividend growth in the last 7 years 40% 1,000,000 8.00% Market-to-Book Ratio 1.25 Depreciation of New Assets 25.00% () What is the value for the proposed measure? Note: The Market-to-Book Ratio is equal to the Market Value per Share divided by the Book Value per Share. The Book Value per Share is the Total Owners' Equity divided by the number of outstanding shares. Dividends and capital gains reinvested $100,000 Index Compounded Return Small Company Stocks 11.7% $16,976 $10,000 S&P 500 Index 10.1% 5.3% $4,673 Intermediate Bonds -One-Month US Treasury Bills US Consumer Price Index 3.5% $1,000 3.0% $100 $93 $21 $13 $10 $1 $0.5 SO 1926 1932 1938 1945 1951 1957 1964 1970 1976 1983 1989 1995 2002 2008 2014 Question 3. The quarterly investors call is approaching and you were asked to comment on the EPS and projected EPS based on the growth forecast of 10%. (a) Compute the EPS for the Current Fiscal Year (b) What is the projected EPS with the same assumptions as in Question 1? You are a bit skeptical of the projected 10% growth in sales and decided to look at a much less aggressive long-run growth scenario of 3.5% growth in sales. (c) What is the projected EPS for a 3.5% growth in sales? If the dividend payout ratio remains the same, how much is paid per share? As some external financing will be needed to accommodate any growth, you started looking into raising debt and/or equity. Since your company would be mostly described as a small- cap US company, you looked at market data to help you determine your costs of equity and debt. Dividends and Captial Gains.png file (d) Using the information on what should be the risk premium for appropriate market for your company? Assume the risk free is given by Imo Treasury Bills. (e) Looking at historical stock market data, you determined that your beta is roughly 1.4 with respect to the market benchmark you used above to compute the risk premium. What should your cost of equity be? (f) In order to get a little more comfortable with the number computed above, you decided to look at the cost of equity using the dividend growth corresponding to the 3.5% sales growth scenario from (C) If you decide to use the average dividend growth value from last 8 years, what is the cost of equity using this approach? Do you think this is a reliable number? If so, why not? In order to determine your cost of debt, you decided to look at your long term debt, which is structured as a single 20yr bond with semi-annual coupons, a coupon rate of 10%, and is currently trading at 83%. You just started a new job as a Finance Manager at XYZ Corp. As you are starting to get acquainted with the company, you requested the Balance Sheet for the Current Fiscal Year 2018, the Income Statement and a few other items that you deemed appropriate. You can find all of those in the table below and in the Excel file attached. Income Statement for the Current Fiscal Year Sales $43,000,000 COGS $30,000,000 Other expenses $5,000,000 Depreciation $2,000,000 EBIT $6,000,000 Interest $2,000,000 Taxable income Taxes (40%) $4,000,000 $1,600,000 Net income $2,400,000 Dividends Add to RE $600,000 $1,800,000 Balance Sheet, Current Fiscal Year Assets Current Assets Cash Accounts Receivable $500,000 $1,000,000 $2,000,000 Inventory Total CA $3,500,000 Liabilities & Owners' Equity Current Liabilities Accounts Payable $1,000,000 Notes Payable $3,000,000 Total CL $4,000,000 Long Term Debt $10,000,000 Owners' Equity Common Stock $6,500,000 Retained Earnings $8,000,000 Total Equity $14,500,000 Total L & OE $28,500,000 Fixed Assets Net PP&E $25,000,000 Total Assets $28,500,000 Additional information Taxes Shares Outstanding Dividend growth in the last 7 years 40% 1,000,000 8.00% Market-to-Book Ratio 1.25 Depreciation of New Assets 25.00% Note: The Market-to-Book Ratio is equal to the Market Value per Share divided by the Book Value per Share. The Book Value per Share is the Total Owners' Equity divided by the number of outstanding shares. You just started a new job as a Finance Manager at XYZ Corp. As you are starting to get acquainted with the company, you requested the Balance Sheet for the Current Fiscal Year 2018, the Income Statement and a few other items that you deemed appropriate. You can find all of those in the table below and in the Excel file attached. Dividends and capital gains reinvested $100,000 As some external financing will be needed to accommodate any growth, you started looking into raising debt and/or equity. Since your company would be mostly described as a small- cap US company, you looked at market data to help you determine your costs of equity and debt. Dividends and Captital Gains Chart (d) Using what should be the risk premium for appropriate market for your company? Assume the risk free is given by 1mo Treasury Bills. Index $16,976 $10,000 Compounded Return Small Company Stocks 11.7% S&P 500 Index 10.1% Intermediate Bonds 5.3% -One-Month US Treasury Bills 3.5% -US Consumer Price Index 3.0% 54,673 Income Statement for the Current Fiscal Year Sales $43,000,000 COGS $30,000,000 Other expenses $5,000,000 Depreciation $2,000,000 EBIT $6,000,000 Interest $2,000,000 Taxable income $4,000,000 Taxes (40%) $1,600,000 Net income $2,400,000 $1,000 (e) Looking at historical stock market data, you determined that your beta is roughly 1.4 with respect to the market benchmark you used above to compute the risk premium. What should your cost of equity be? (f) In order to get a little more comfortable with the number computed above, you decided to look at the cost of equity using the dividend growth corresponding to the 3.5% sales growth scenario from ). If you decide to use the average dividend growth value from last 8 years, what is the cost of equity using this approach? Do you think this is a reliable number? If so, why not? $100 $93 Dividends Add to RE $600,000 $1,800,000 $21 $13 $10 In order to determine your cost of debt, you decided to look at your long term debt, which is structured as a single 20yr bond with semi-annual coupons, a coupon rate of 10%, and is currently trading at 83%. Balance Sheet, Current Fiscal Year Assets $1 4 $0.5 Current Assets Cash Accounts Receivable $500,000 $1,000,000 SO 1926 1932 1938 1945 1951 1957 1964 1970 1976 1983 1989 1995 2002 2008 2014 Inventory Total CA $2,000,000 $3,500,000 Liabilities & Owners' Equity Current Liabilities Accounts Payable $1,000,000 Notes Payable $3,000,000 Total CL $4,000,000 Long Term Debt $10,000,000 Owners' Equity Common Stock $6,500,000 Retained Earnings $8,000,000 Total Equity $14,500,000 Total L & OE $28,500,000 Fixed Assets Net PP&E $25,000,000 (g) What is your cost of debt? (h) What is your after-tax cost of debt? Total Assets $28,500,000 Your CEO is interested in knowing what is the minimum return the company should generate to make sure investors are satisfied, but is not sure which number to focus on. (i) What measure should you propose and how would you explain it to your CEO? Additional information Taxes Shares Outstanding Dividend growth in the last 7 years 40% 1,000,000 8.00% Market-to-Book Ratio 1.25 Depreciation of New Assets 25.00% () What is the value for the proposed measure? Note: The Market-to-Book Ratio is equal to the Market Value per Share divided by the Book Value per Share. The Book Value per Share is the Total Owners' Equity divided by the number of outstanding shares. Dividends and capital gains reinvested $100,000 Index Compounded Return Small Company Stocks 11.7% $16,976 $10,000 S&P 500 Index 10.1% 5.3% $4,673 Intermediate Bonds -One-Month US Treasury Bills US Consumer Price Index 3.5% $1,000 3.0% $100 $93 $21 $13 $10 $1 $0.5 SO 1926 1932 1938 1945 1951 1957 1964 1970 1976 1983 1989 1995 2002 2008 2014 Question 3. The quarterly investors call is approaching and you were asked to comment on the EPS and projected EPS based on the growth forecast of 10%. (a) Compute the EPS for the Current Fiscal Year (b) What is the projected EPS with the same assumptions as in Question 1? You are a bit skeptical of the projected 10% growth in sales and decided to look at a much less aggressive long-run growth scenario of 3.5% growth in sales. (c) What is the projected EPS for a 3.5% growth in sales? If the dividend payout ratio remains the same, how much is paid per share? As some external financing will be needed to accommodate any growth, you started looking into raising debt and/or equity. Since your company would be mostly described as a small- cap US company, you looked at market data to help you determine your costs of equity and debt. Dividends and Captial Gains.png file (d) Using the information on what should be the risk premium for appropriate market for your company? Assume the risk free is given by Imo Treasury Bills. (e) Looking at historical stock market data, you determined that your beta is roughly 1.4 with respect to the market benchmark you used above to compute the risk premium. What should your cost of equity be? (f) In order to get a little more comfortable with the number computed above, you decided to look at the cost of equity using the dividend growth corresponding to the 3.5% sales growth scenario from (C) If you decide to use the average dividend growth value from last 8 years, what is the cost of equity using this approach? Do you think this is a reliable number? If so, why not? In order to determine your cost of debt, you decided to look at your long term debt, which is structured as a single 20yr bond with semi-annual coupons, a coupon rate of 10%, and is currently trading at 83%. You just started a new job as a Finance Manager at XYZ Corp. As you are starting to get acquainted with the company, you requested the Balance Sheet for the Current Fiscal Year 2018, the Income Statement and a few other items that you deemed appropriate. You can find all of those in the table below and in the Excel file attached. Income Statement for the Current Fiscal Year Sales $43,000,000 COGS $30,000,000 Other expenses $5,000,000 Depreciation $2,000,000 EBIT $6,000,000 Interest $2,000,000 Taxable income Taxes (40%) $4,000,000 $1,600,000 Net income $2,400,000 Dividends Add to RE $600,000 $1,800,000 Balance Sheet, Current Fiscal Year Assets Current Assets Cash Accounts Receivable $500,000 $1,000,000 $2,000,000 Inventory Total CA $3,500,000 Liabilities & Owners' Equity Current Liabilities Accounts Payable $1,000,000 Notes Payable $3,000,000 Total CL $4,000,000 Long Term Debt $10,000,000 Owners' Equity Common Stock $6,500,000 Retained Earnings $8,000,000 Total Equity $14,500,000 Total L & OE $28,500,000 Fixed Assets Net PP&E $25,000,000 Total Assets $28,500,000 Additional information Taxes Shares Outstanding Dividend growth in the last 7 years 40% 1,000,000 8.00% Market-to-Book Ratio 1.25 Depreciation of New Assets 25.00% Note: The Market-to-Book Ratio is equal to the Market Value per Share divided by the Book Value per Share. The Book Value per Share is the Total Owners' Equity divided by the number of outstanding shares
Step by Step Solution
There are 3 Steps involved in it

Get step-by-step solutions from verified subject matter experts