

Question: please answer question30 and use the data Question Completion Status: 40 106113 34 BESTE 25 30 316 reduction in automation early customization of the product
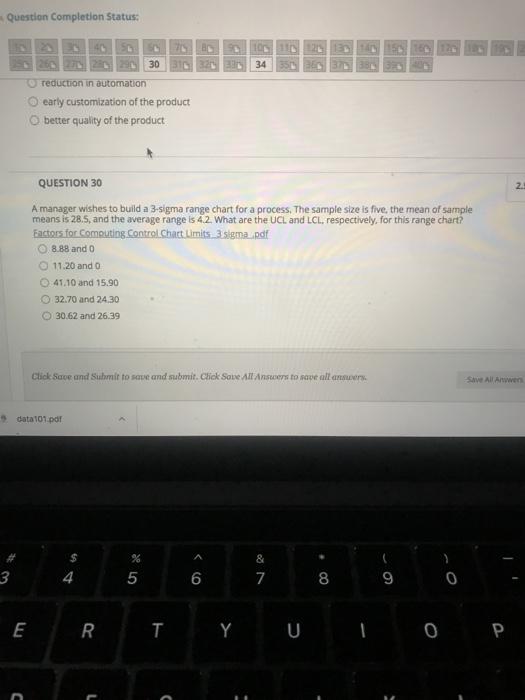
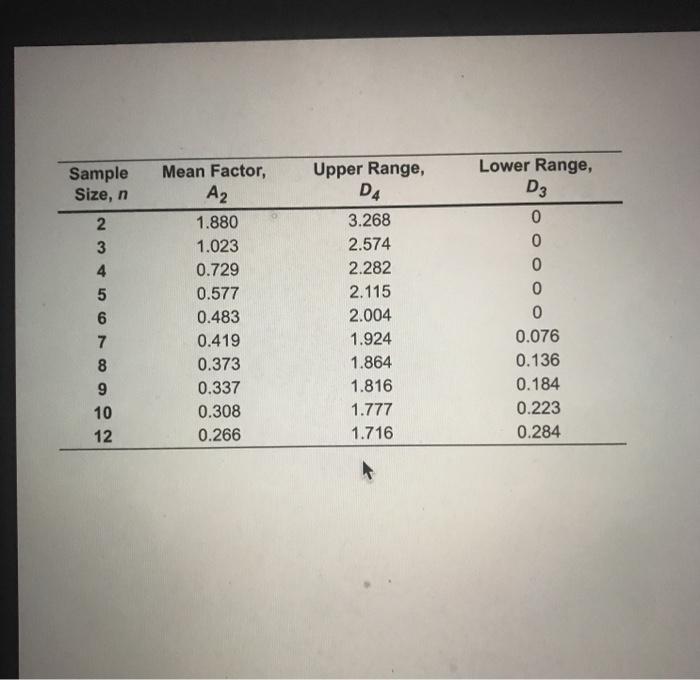 please answer question30 and use the data
 Step by Step Solution
There are 3 Steps involved in it
1 Expert Approved Answer
Step: 1 Unlock

Question Has Been Solved by an Expert!
Get step-by-step solutions from verified subject matter experts
Step: 2 Unlock
Step: 3 Unlock