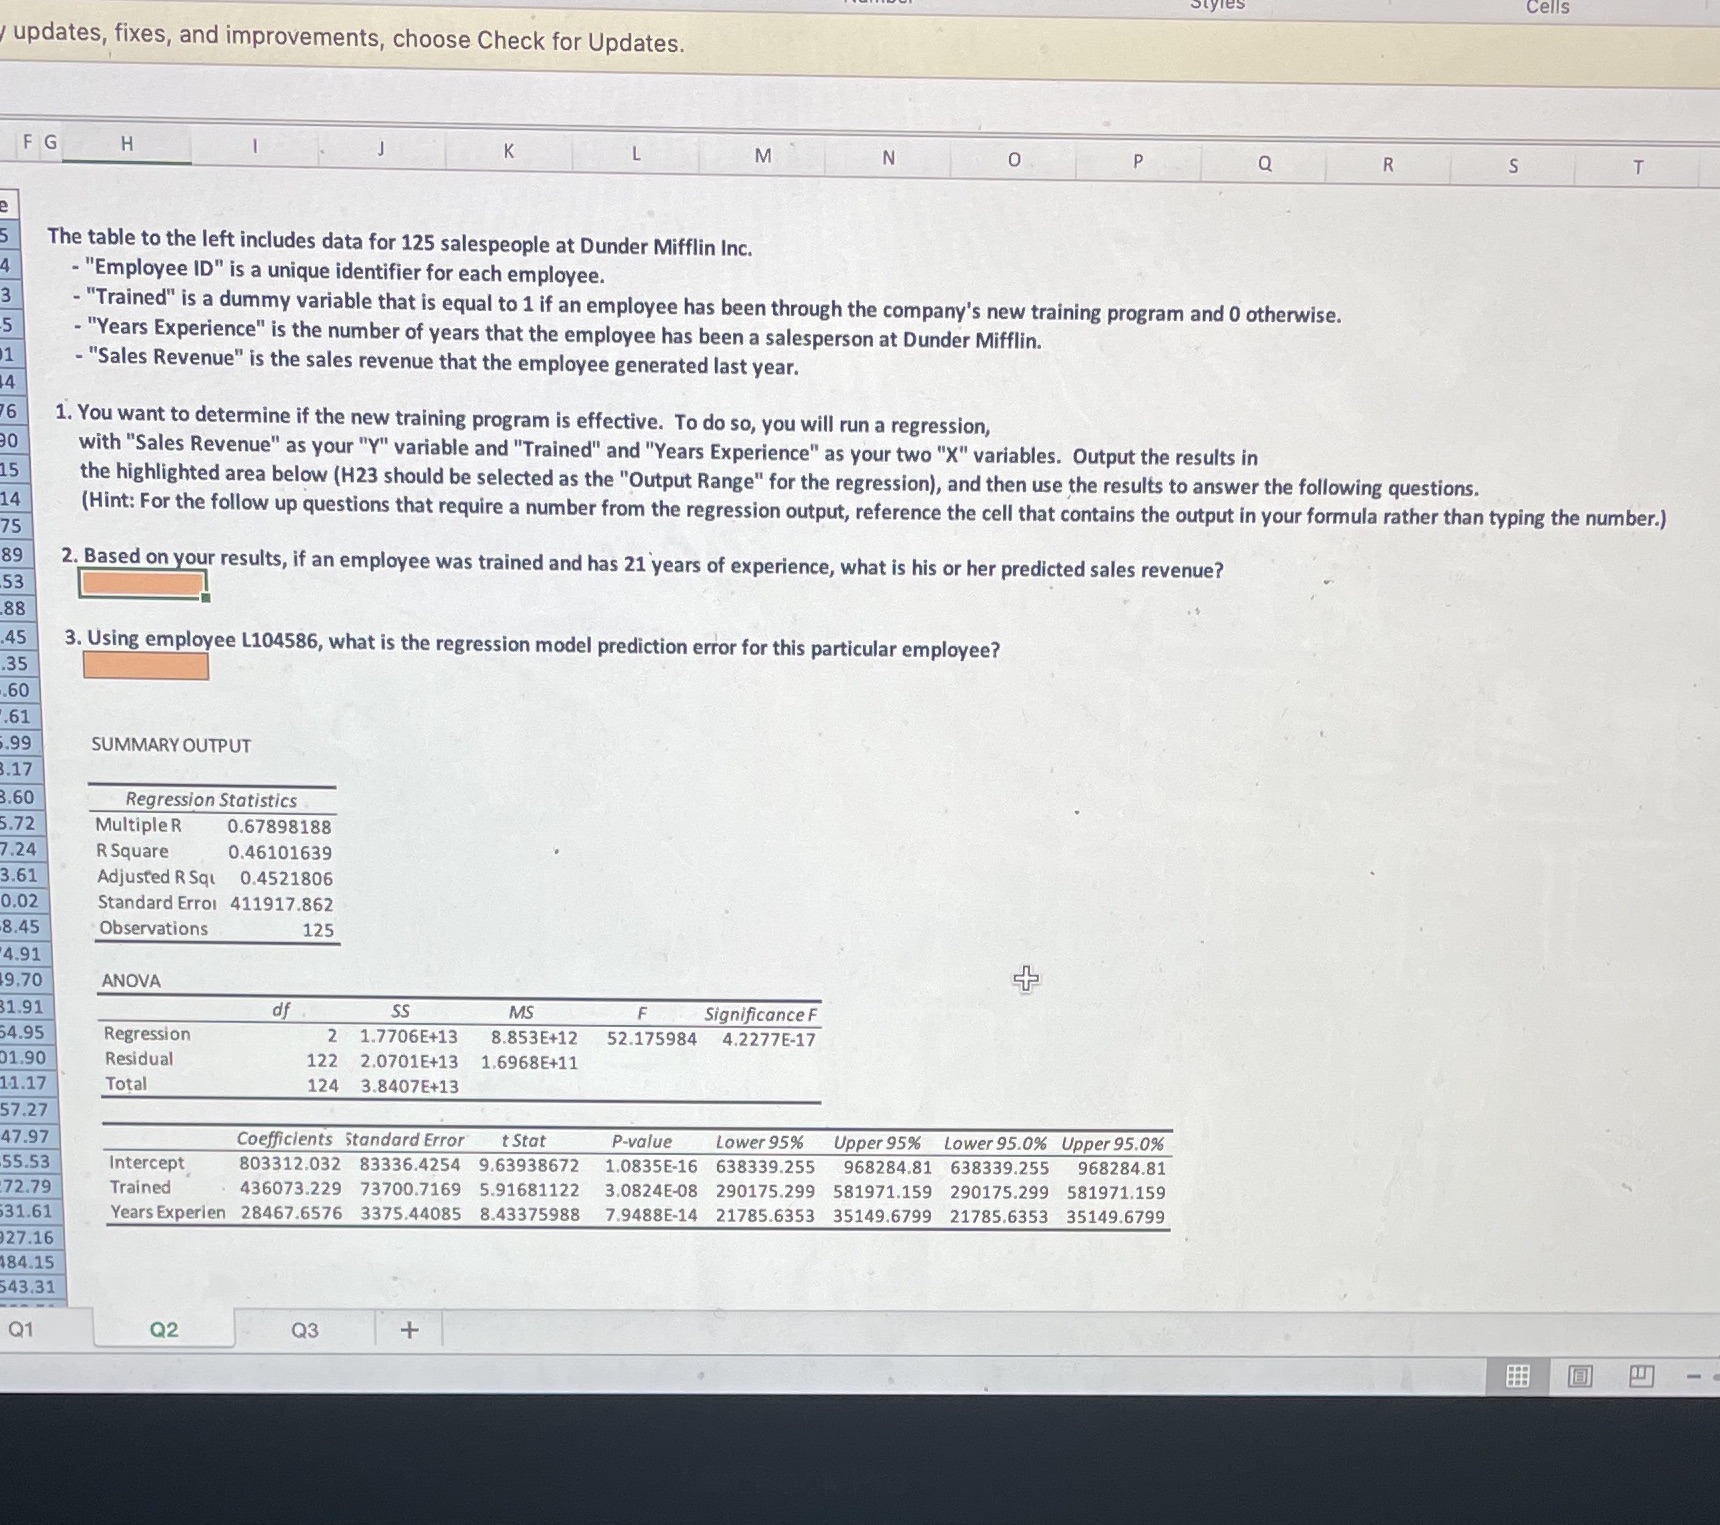
Question: Please answer questions 2 and 3 using information from the regression analysis. Please show excel formulas!!! updates, fixes, and improvements, choose Check for Updates. F

Please answer questions 2 and 3 using information from the regression analysis. Please show excel formulas!!!

Please answer questions 2 and 3 using information
updates, fixes, and improvements, choose Check for Updates. F G H K L M N 0 P Q R S T The table to the left includes data for 125 salespeople at Dunder Mifflin Inc. "Employee ID" is a unique identifier for each employee. "Trained" is a dummy variable that is equal to 1 if an employee has been through the company's new training program and 0 otherwise. "Years Experience" is the number of years that the employee has been a salesperson at Dunder Mifflin. "Sales Revenue" is the sales revenue that the employee generated last year. 1. You want to determine if the new training program is effective. To do so, you will run a regression, with "Sales Revenue" as your "Y" variable and "Trained" and "Years Experience" as your two "X" variables. Output the results in the highlighted area below (H23 should be selected as the "Output Range" for the regression), and then use the results to answer the following questions. (Hint: For the follow up questions that require a number from the regression output, reference the cell that contains the output in your formula rather than typing the number.) 2. Based on your results, if an employee was trained and has 21 years of experience, what is his or her predicted sales revenue? 88 45 3. Using employee L104586, what is the regression model prediction error for this particular employee? .60 .61 SUMMARY OUTPUT .17 .60 Regression 1.72 Multiple R 0.67898188 7.24 R Square 0.46101639 3.61 Adjusted R Sql 0.4521806 0.02 Standard Errol 411917.862 8.45 Observations 125 4.91 9.70 ANOVA 31.91 SS MS Significance F 54.95 Regression 2 1.7706E+13 8.853E+12 52.175984 4.2277E-17 01.90 Residual 122 2.0701E+13 1.6968E+11 11.17 Total 124 3.8407E+13 47.97 Coefficients Standard Error t Stat P-value Lower 95% Upper 95% Lower 95.0% Upper 95.0% 55.53 Intercept 803312.032 83336.4254 9.63938672 1.0835E-16 638339.255 968284.81 638339.255 968284.81 72.79 Trained 436073.229 73700.7169 5.91681122 3.0824E-08 290175.299 581971.159 290175.299 581971.159 31.61 Years Experien 28467.6576 3375.44085 8.43375988 7.9488E-14 21785.6353 35149.6799 21785.6353 35149.6799 27.16 43.31 02 +

Step by Step Solution

There are 3 Steps involved in it

1 Expert Approved Answer
Step: 1 Unlock blur-text-image
Question Has Been Solved by an Expert!

Get step-by-step solutions from verified subject matter experts

Step: 2 Unlock
Step: 3 Unlock

Students Have Also Explored These Related Finance Questions!