

Question: Please answer Questions 3 through 6 For Q3a: assume a customer buys 1 Big Belly in the year and don't buy any additional units after
Please answer Questions 3 through 6
For Q3a: assume a customer buys 1 Big Belly in the year and don't buy any additional units after that. Remember the licensing fee.
For Q6: Use both the Big Belly and Hippo gross revenues and total costs in dollars. Plot the curves and then make an analysis.
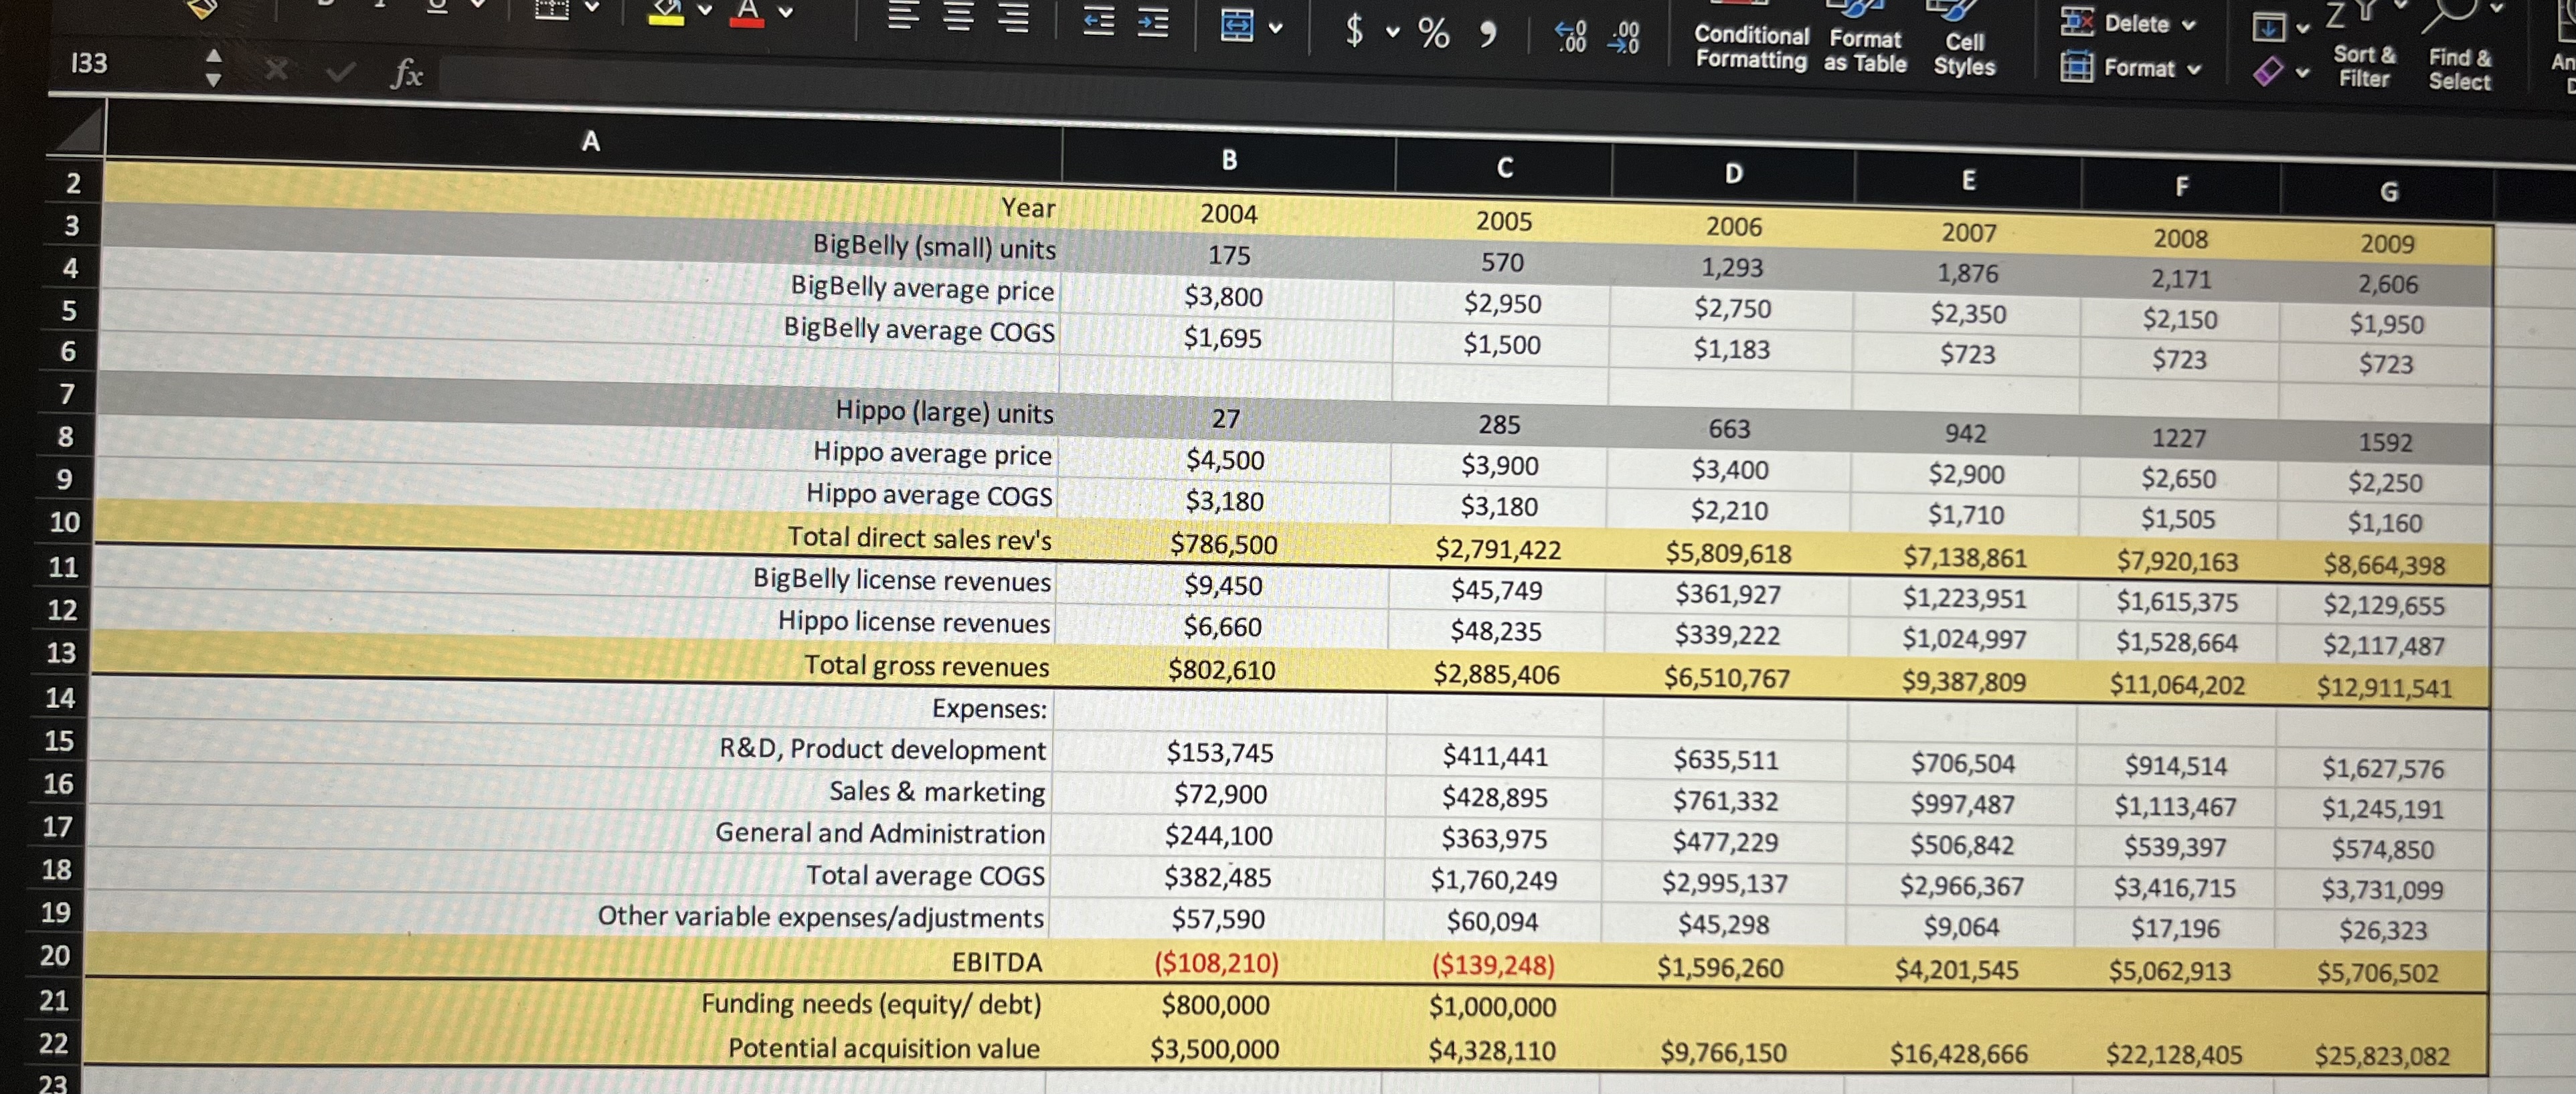
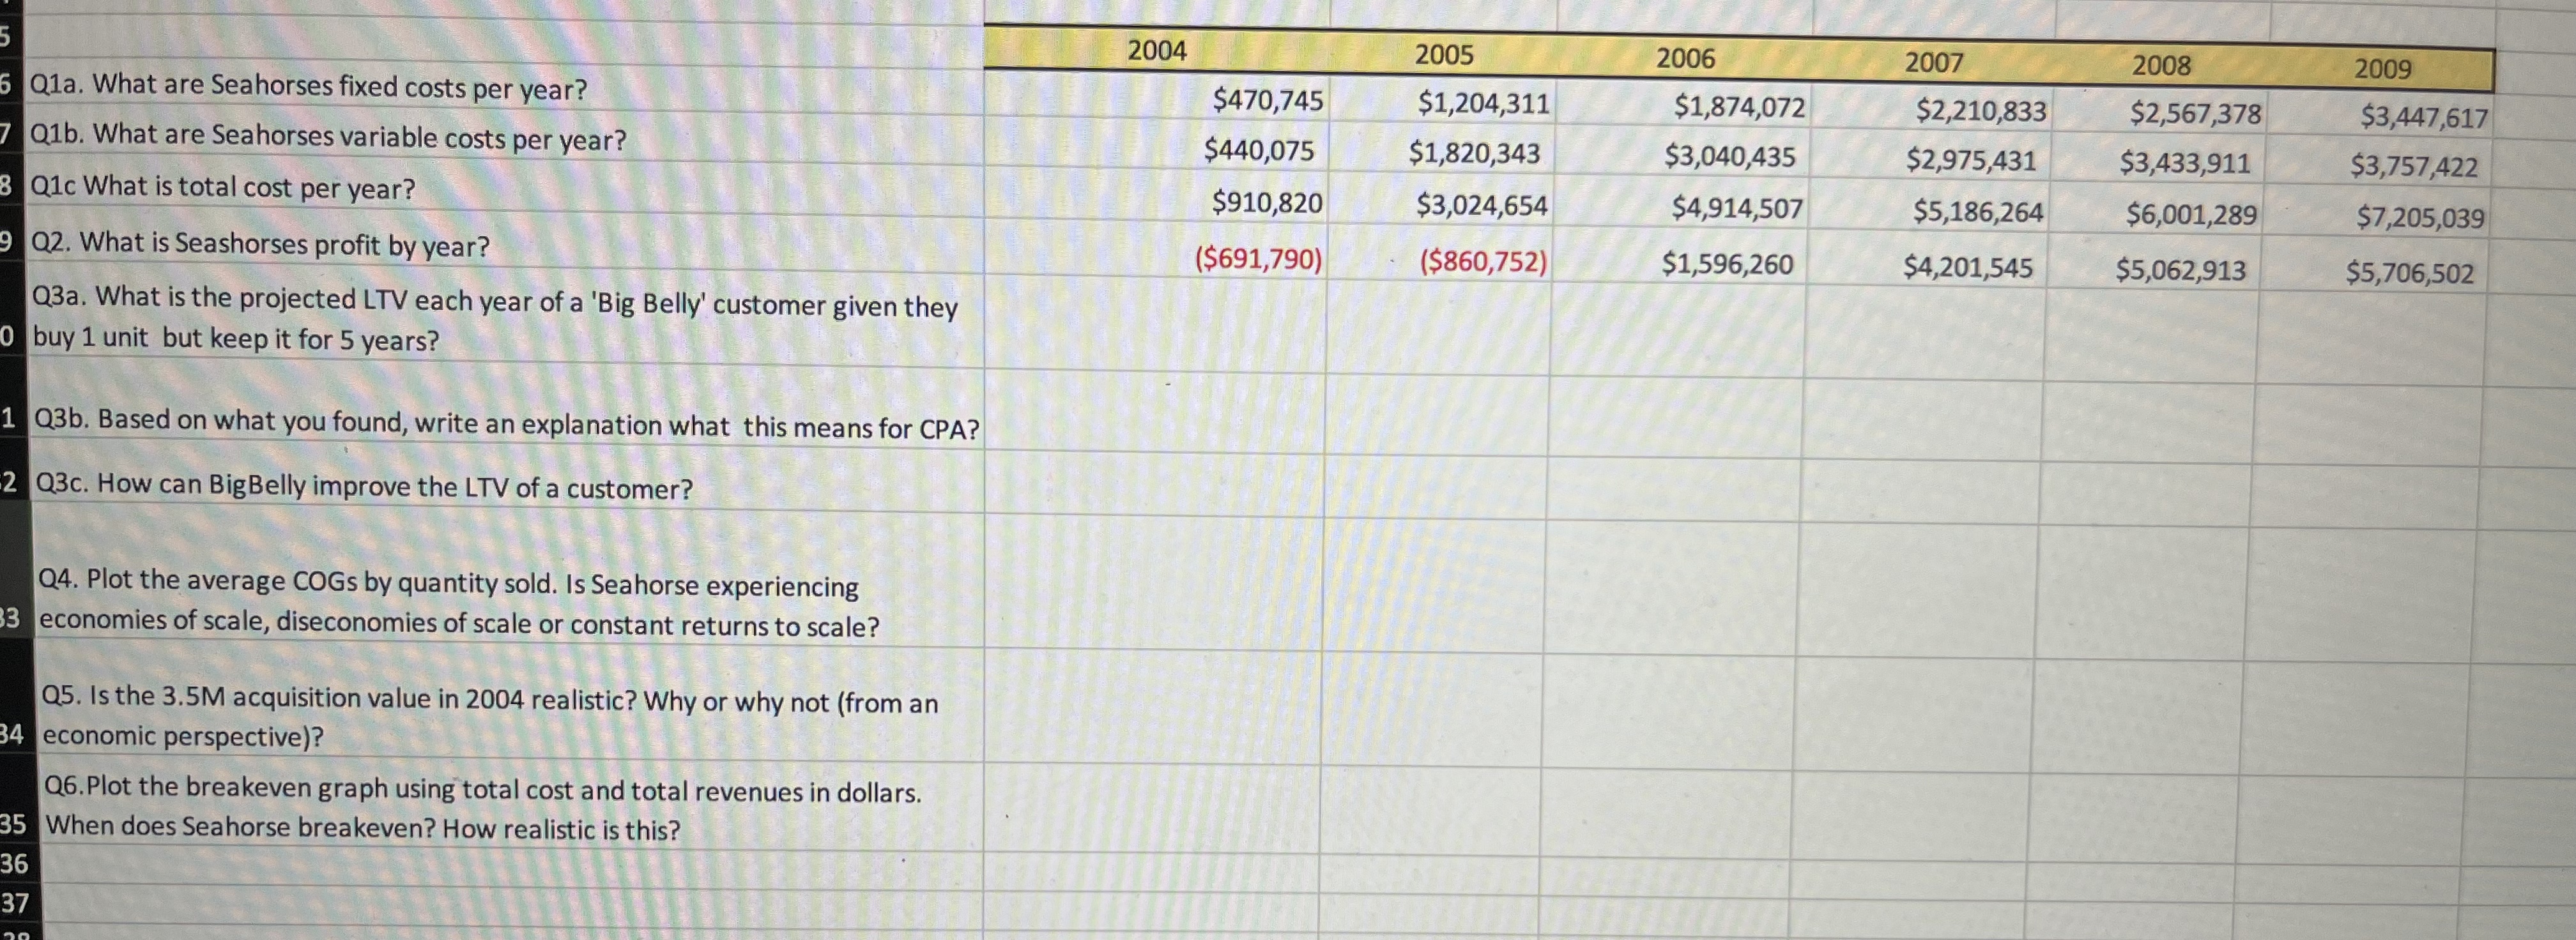
Q1a. What are Seahorses fixed costs per year? Q1b. What are Seahorses variable costs per year? Q1c What is total cost per year? Q2. What is Seashorses profit by year? \begin{tabular}{|c|c|c|c|c|c|} \hline 2004 & 2005 & 2006 & 2007 & 2008 & 2009 \\ \hline$470,745 & $1,204,311 & $1,874,072 & $2,210,833 & $2,567,378 & $3,447,617 \\ \hline$440,075 & $1,820,343 & $3,040,435 & $2,975,431 & $3,433,911 & $3,757,422 \\ \hline$910,820 & $3,024,654 & $4,914,507 & $5,186,264 & $6,001,289 & $7,205,039 \\ \hline($691,790) & ($860,752) & $1,596,260 & $4,201,545 & $5,062,913 & $5,706,502 \\ \hline \end{tabular} Q3a. What is the projected LTV each year of a 'Big Belly' customer given they buy 1 unit but keep it for 5 years? Q3b. Based on what you found, write an explanation what this means for CPA? Q3c. How can BigBelly improve the LTV of a customer? Q4. Plot the average COGs by quantity sold. Is Seahorse experiencing economies of scale, diseconomies of scale or constant returns to scale? Q5. Is the 3.5M acquisition value in 2004 realistic? Why or why not (from an economic perspective)? Q6.Plot the breakeven graph using total cost and total revenues in dollars. When does Seahorse breakeven? How realistic is this
Step by Step Solution
There are 3 Steps involved in it

Get step-by-step solutions from verified subject matter experts