

Question: Please answer questions (d) and (e) and showing the computations in excel format. As Figure 1 shows, the stock price of Cisco Systems peaked in
Please answer questions (d) and (e) and showing the computations in excel format.
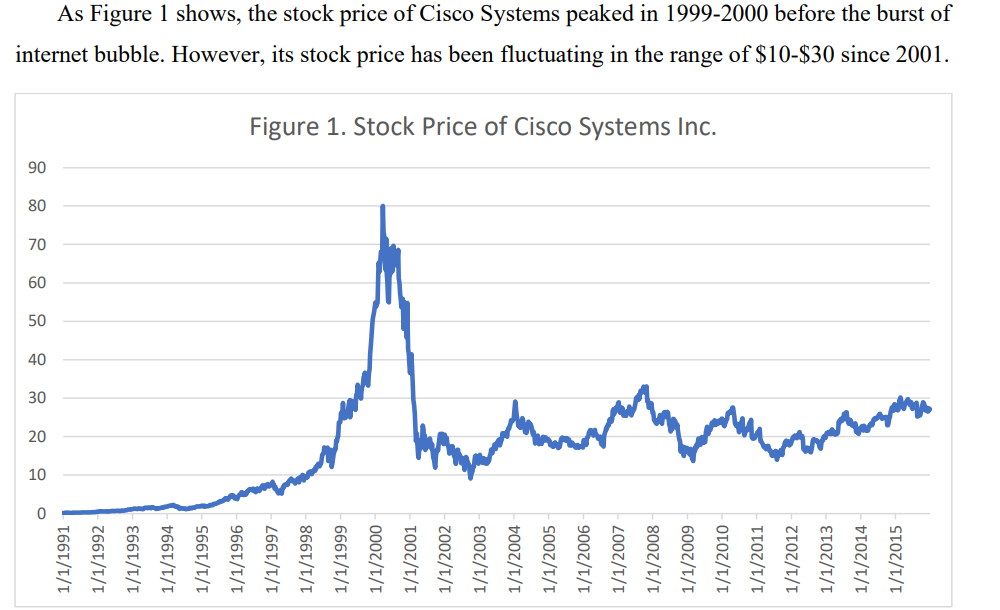
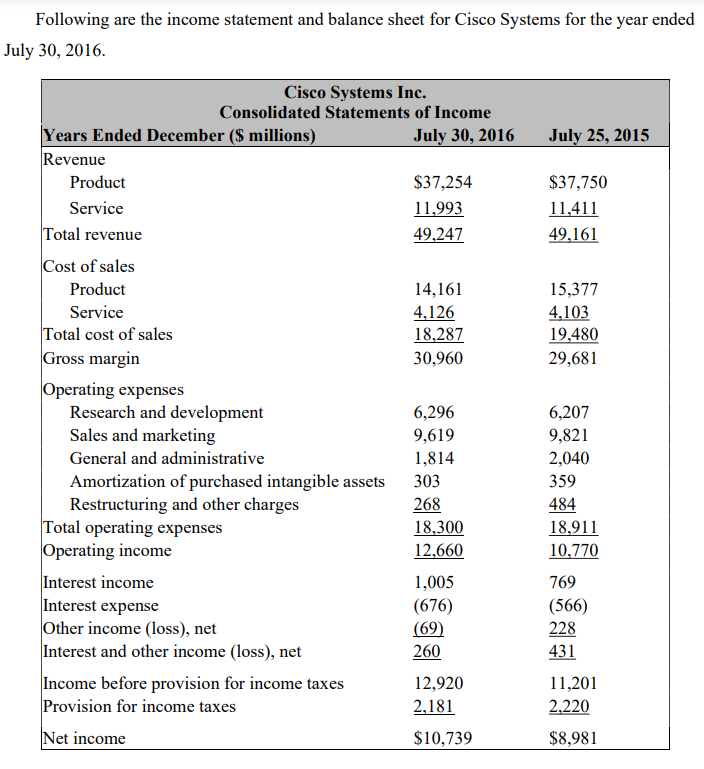
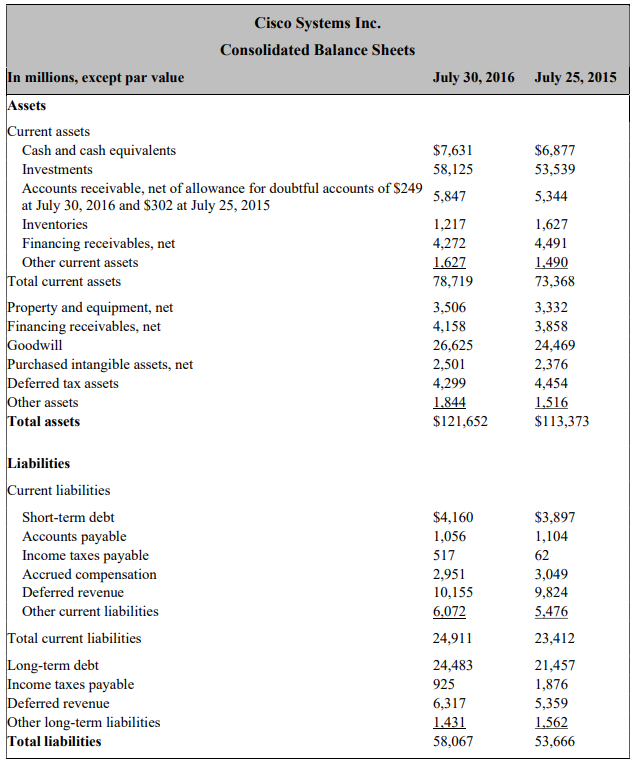
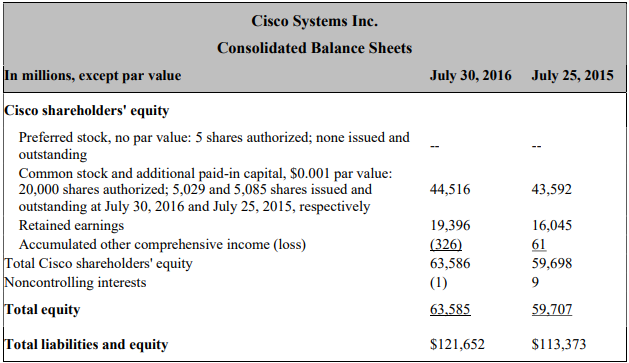
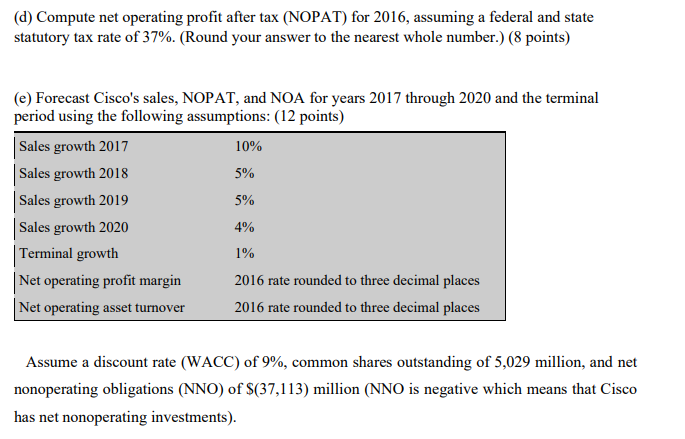
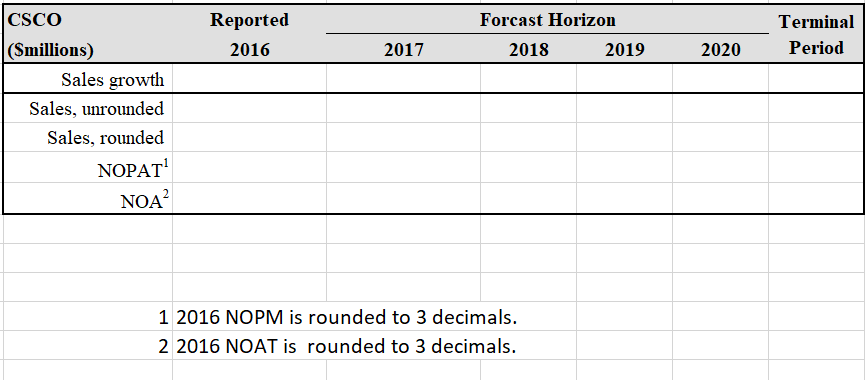
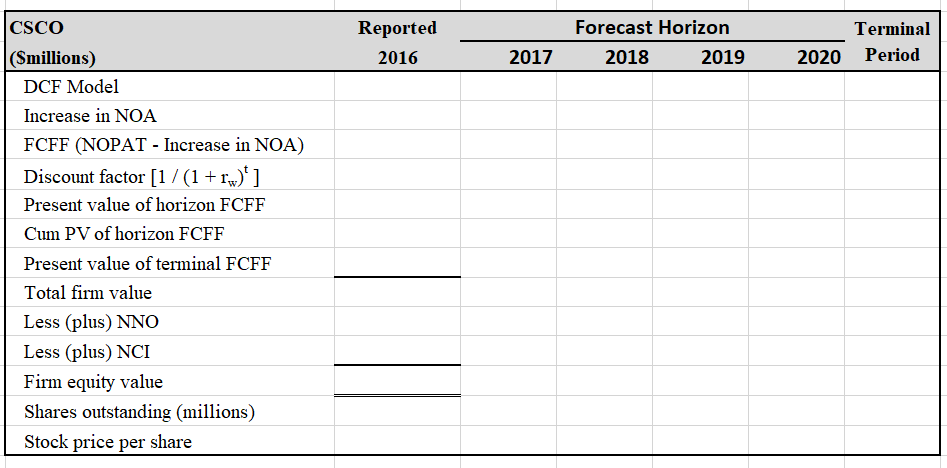
As Figure 1 shows, the stock price of Cisco Systems peaked in 1999-2000 before the burst of internet bubble. However, its stock price has been fluctuating in the range of $10$30 since 2001 . Following are the income statement and balance sheet for Cisco Systems for the year ended ly \begin{tabular}{|c|c|c|} \hline \multicolumn{3}{|l|}{\begin{tabular}{l} Cisco Systems Inc. \\ Consolidated Balance Sheets \end{tabular}} \\ \hline In millions, except par value & July 30, 2016 & July 25,2015 \\ \hline \multicolumn{3}{|l|}{ Assets } \\ \hline \multicolumn{3}{|l|}{ Current assets } \\ \hline Cash and cash equivalents & $7,631 & $6,877 \\ \hline Investments & 58,125 & 53,539 \\ \hline \begin{tabular}{l} Accounts receivable, net of allowance for doubtful accounts of \$249 \\ at July 30,2016 and $302 at July 25,2015 \end{tabular} & 5,847 & 5,344 \\ \hline Inventories & 1,217 & 1,627 \\ \hline Financing receivables, net & 4,272 & 4,491 \\ \hline Other current assets & 1.627 & 1,490 \\ \hline Total current assets & 78,719 & 73,368 \\ \hline Property and equipment, net & 3,506 & 3,332 \\ \hline Financing receivables, net & 4,158 & 3,858 \\ \hline Goodwill & 26,625 & 24,469 \\ \hline Purchased intangible assets, net & 2,501 & 2,376 \\ \hline Deferred tax assets & 4,299 & 4,454 \\ \hline Other assets & 1.844 & 1,516 \\ \hline Total assets & $121,652 & $113,373 \\ \hline \multicolumn{3}{|l|}{ Liabilities } \\ \hline \multicolumn{3}{|l|}{ Current liabilities } \\ \hline Short-term debt & $4,160 & $3,897 \\ \hline Accounts payable & 1,056 & 1,104 \\ \hline Income taxes payable & 517 & 62 \\ \hline Accrued compensation & 2,951 & 3,049 \\ \hline Deferred revenue & 10,155 & 9,824 \\ \hline Other current liabilities & 6,072 & 5,476 \\ \hline Total current liabilities & 24,911 & 23,412 \\ \hline Long-term debt & 24,483 & 21,457 \\ \hline Income taxes payable & 925 & 1,876 \\ \hline Deferred revenue & 6,317 & 5,359 \\ \hline Other long-term liabilities & 1.431 & 1,562 \\ \hline Total liabilities & 58,067 & 53,666 \\ \hline \end{tabular} \begin{tabular}{|c|c|c|} \hline \multicolumn{3}{|l|}{\begin{tabular}{l} Cisco Systems Inc. \\ Consolidated Balance Sheets \end{tabular}} \\ \hline In millions, except par value & July 30, 2016 & July 25,2015 \\ \hline \multicolumn{3}{|l|}{ Cisco shareholders' equity } \\ \hline \begin{tabular}{l} Preferred stock, no par value: 5 shares authorized; none issued and \\ outstanding \end{tabular} & - & -- \\ \hline \begin{tabular}{l} Common stock and additional paid-in capital, $0.001 par value: \\ 20,000 shares authorized; 5,029 and 5,085 shares issued and \\ outstanding at July 30,2016 and July 25,2015 , respectively \end{tabular} & 44,516 & 43,592 \\ \hline Retained earnings & 19,396 & 16,045 \\ \hline Accumulated other comprehensive income (loss) & (326) & 61 \\ \hline Total Cisco shareholders' equity & 63,586 & 59,698 \\ \hline Noncontrolling interests & (1) & 9 \\ \hline Total equity & 63,585 & 59,707 \\ \hline Total liabilities and equity & $121,652 & $113,373 \\ \hline \end{tabular} (d) Compute net operating profit after tax (NOPAT) for 2016, assuming a federal and state statutory tax rate of 37%. (Round your answer to the nearest whole number.) ( 8 points) (e) Forecast Cisco's sales, NOPAT, and NOA for years 2017 through 2020 and the terminal period using the following assumptions: (12 points) Assume a discount rate (WACC) of 9%, common shares outstanding of 5,029 million, and net nonoperating obligations (NNO) of $(37,113) million (NNO is negative which means that Cisco has net nonoperating investments). \begin{tabular}{|c|c|c|c|c|c|c|} \hline \multirow{2}{*}{\begin{tabular}{l} CSCO \\ (Smillions) \end{tabular}} & \multirow{2}{*}{\begin{tabular}{c} Reported \\ 2016 \\ \end{tabular}} & \multicolumn{4}{|c|}{ Forecast Horizon } & \multirow{2}{*}{\begin{tabular}{c} Terminal \\ Period \\ \end{tabular}} \\ \hline & & 2017 & 2018 & 2019 & 2020 & \\ \hline \multicolumn{7}{|l|}{ DCF Model } \\ \hline \multicolumn{7}{|l|}{ Increase in NOA } \\ \hline \multicolumn{7}{|c|}{ FCFF (NOPAT - Increase in NOA) } \\ \hline \multicolumn{7}{|c|}{ Discount factor [1/(1+rw)t]} \\ \hline \multicolumn{7}{|c|}{ Present value of horizon FCFF} \\ \hline \multicolumn{7}{|c|}{ Cum PV of horizon FCFF } \\ \hline \multicolumn{7}{|c|}{ Present value of terminal FCFF } \\ \hline \multicolumn{7}{|l|}{ Total firm value } \\ \hline \multicolumn{7}{|l|}{ Less (plus) NNO } \\ \hline \multicolumn{7}{|l|}{ Less (plus) NCI } \\ \hline \multicolumn{7}{|l|}{ Firm equity value } \\ \hline \multicolumn{7}{|c|}{ Shares outstanding (millions) } \\ \hline Stock price per share & & & & & & \\ \hline \end{tabular}
Step by Step Solution
There are 3 Steps involved in it

Get step-by-step solutions from verified subject matter experts