

Question: Please answer questions Find and interpret a 99% confidence interval for the mean increase in fluoride concentration for those with fluoridated tap water. Let Group
Please answer questions
Find and interpret a 99% confidence interval for the mean increase in fluoride concentration for those with fluoridated tap water. Let Group 1 represent those with fluoridated tap water and Group 2 represent those without fluoridated tap water.
Confidence interval:to(round to three decimal places)
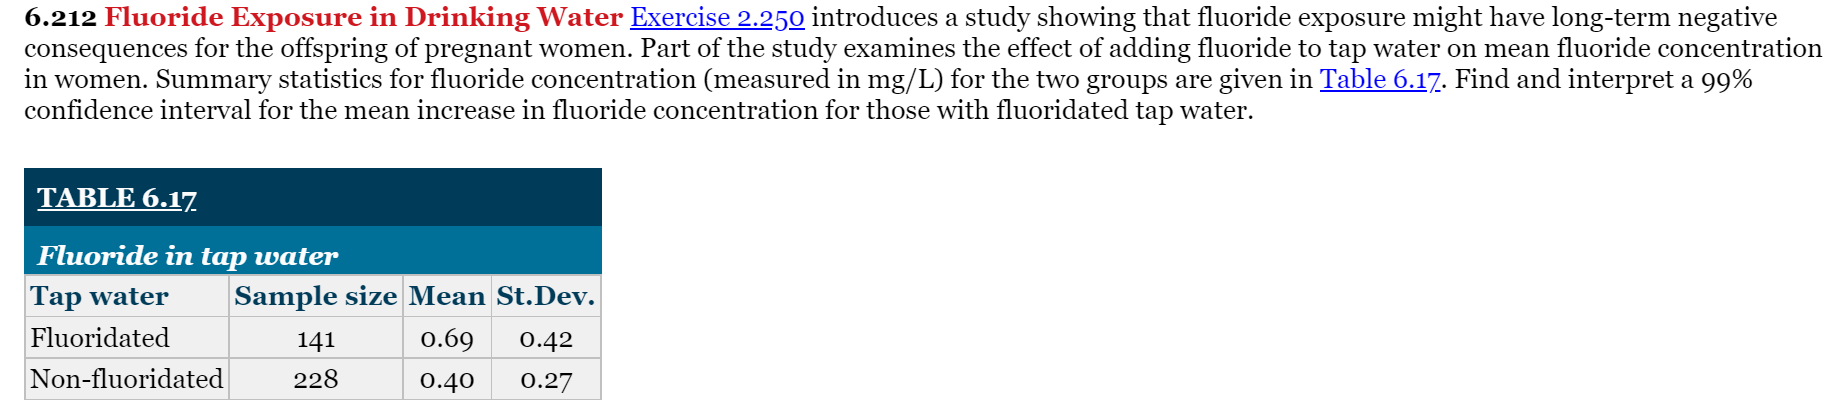
6.212 Fluoride Exposure in Drinking Water Exercise 2.250 introduces a study showing that fluoride exposure might have long-term negative consequences for the offspring of pregnant women. Part of the study examines the effect of adding fluoride to tap water on mean fluoride concentration in women. Summary statistics for fluoride concentration (measured in mg/L) for the two groups are given in Table 6.17. Find and interpret a 99% confidence interval for the mean increase in fluoride concentration for those with fluoridated tap water. TABLE 6.17. Fluoride in tap water Tap water Sample size Mean St.Dev. Fluoridated 141 0.69 0.42 Non-fluoridated 228 0.40 0.27
Step by Step Solution
There are 3 Steps involved in it

Get step-by-step solutions from verified subject matter experts