

Question: Please answer questions in pic Below is a scatterplot of data collected from 9 students for their average one-way connnute times (in minutes) and their
Please answer questions in pic
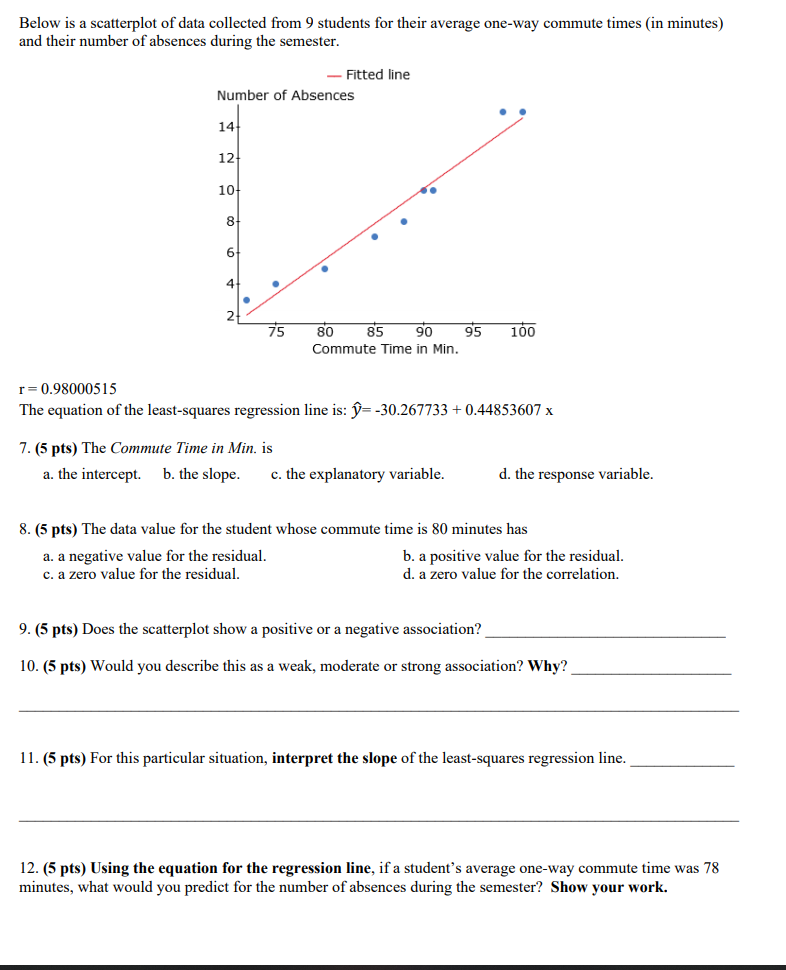
Below is a scatterplot of data collected from 9 students for their average one-way connnute times (in minutes) and their number of absences during the somester. Fitted line Number of Absences 3'5 80 85 90 95 IUD Commute Tune in Hin. r = H.93DDI1515 The equation of the least-squares regression line is: j}= -3l126??33 + 0.4485360? x 'T. {5 [Its] The Commute Time in Min. is a. the intercept. b. the slope. c. the explanatory variable. d. the response variable. 3. {5 pts} The data value for the student whose oornrnute time is SCI minutes has a. a negative value for the residual. b. a positive value for the residual. c. a Zero vaIUe for the residual. d. a Zero value for the correlation. 9. {5 pts} Does the soatterplot show a positive or a negative association? III}. {5 pts) Would you describe this as a Weak, moderate or strong association? Why? 1 1. {5 pts) For this particular situation1 interpret the slope of the least-squares regression line. 12. {5 pts) Using the equation for the regression line, if a student's average oneway commute time was T8 minutes, what would you predict for the number of absences during the semester? Show your work
Step by Step Solution
There are 3 Steps involved in it

Get step-by-step solutions from verified subject matter experts