

Question: Please answer questions in the Excel spread sheet picture. Project Part 4 - Hypothesis Testing Based on your sample, you will conduct a hypothesis test
Please answer questions in the Excel spread sheet picture.
Project Part 4 - Hypothesis Testing
Based on your sample, you will conduct a hypothesis test withto test two of the claims of the above article.
Using the same excel sheet as last week,answer the following in the "week 6" tab:
- Claim: the average age of online students is 32 years old. Can you prove it is not?
- What is the null hypothesis?
- What is the alternative hypothesis?
- What distribution should be used?
- What is the test statistic?
- What is the p-value?
- What is the conclusion?
- How do we interpret the results, in context of our study?
- Claim: the proportion of males in online classes is 35%. Can you prove it is not?
- What is the null hypothesis?
- What is the alternative hypothesis?
- What distribution should be used?
- What is the test statistic?
- What is the p-value?
- What is the conclusion?
- How do we interpret the results, in context of our study?
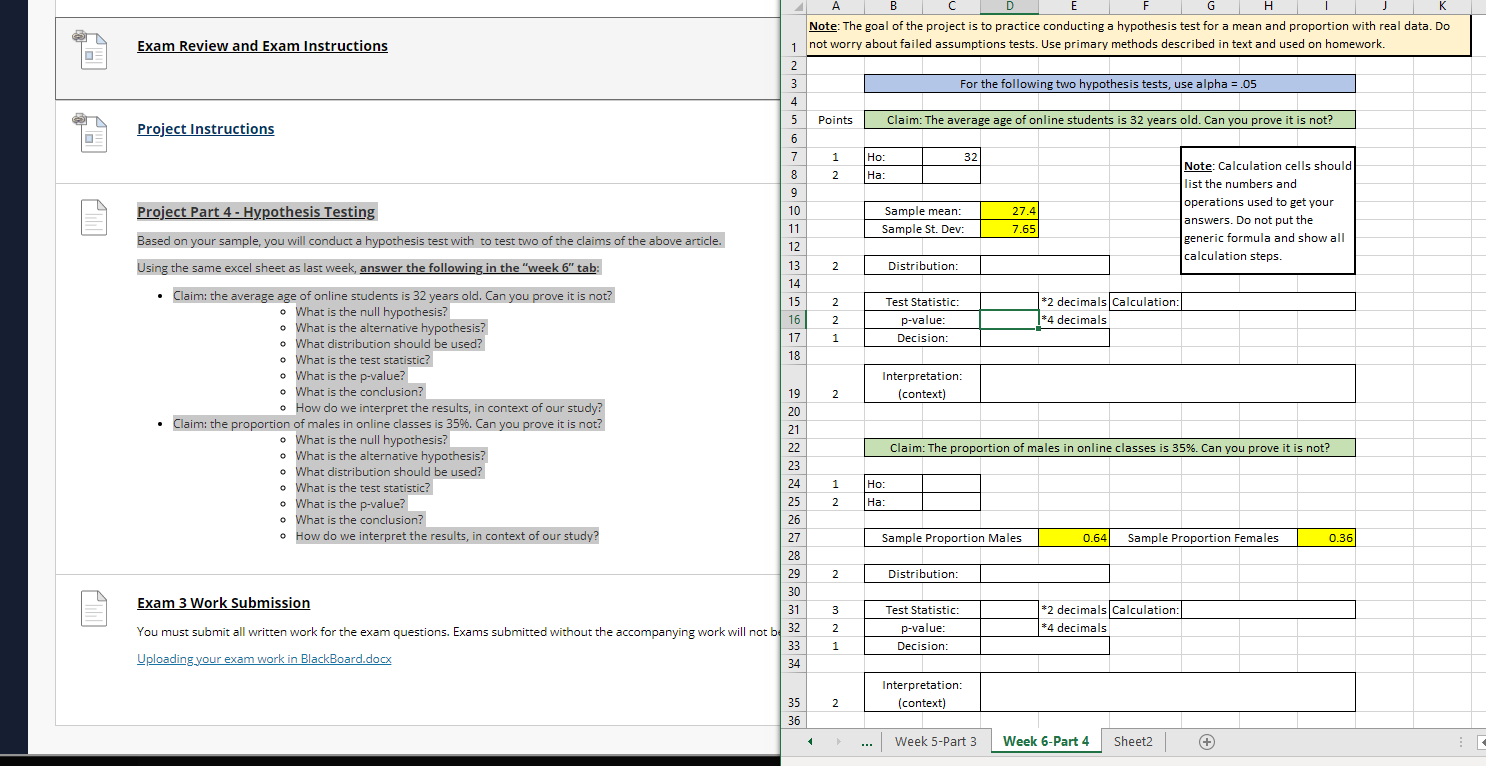
A Note: The goal of the project is to practice conducting a hypothesis test for a mean and proportion with real data. Do Exam Review and Exam Instructions not worry about failed assumptions tests. Use primary methods described in text and used on homework. For the following two hypothesis tests, use alpha = .05 JO UI B W N - Points Claim: The average age of online students is 32 years old. Can you prove it is not? Project Instructions 1 Ho 32 Note: Calculation cells should 8 Ha list the numbers and 9 operations used to get your Project Part 4 - Hypothesis Testing 10 Sample mean: 27.4 answers. Do not put the 11 Sample St. Dev: 7.65 Based on your sample, you will conduct a hypothesis test with to test two of the claims of the above article. generic formula and show all 12 calculation steps. Using the same excel sheet as last week, answer the following in the "week 6" tab: 13 2 Distribution: 14 . Claim: the average age of online students is 32 years old. Can you prove it is not? 15 2 Test Statistic: *2 decimals Calculation . What is the null hypothesis? 16 p-value: #4 decimals What is the alternative hypothesis? 17 Decision: . What distribution should be used? 18 What is the test statistic? o What is the p-value? Interpretation: . What is the conclusion? 19 2 (context) o How do we interpret the results, in context of our study? 20 . Claim: the proportion of males in online classes is 359%. Can you prove it is not? 21 . What is the null hypothesis? 22 Claim: The proportion of males in online classes is 35%. Can you prove it is not? What is the alternative hypothesis? 23 What distribution should be used? 1 Ho What is the test statistic? 24 What is the p-value? 25 Ha What is the conclusion? 26 How do we interpret the results, in context of our study? 27 Sample Proportion Males 0.64 Sample Proportion Females 0.36 28 29 2 Distribution: 30 Exam 3 Work Submission 31 3 Test Statistic: *2 decimals Calculation: IN You must submit all written work for the exam questions. Exams submitted without the accompanying work will not be 32 p-value: #4 decimals 33 Decision: Uploading your exam work in BlackBoard.docx 34 Interpretation: 35 2 (context) 36 . . . Week 5-Part 3 Week 6-Part 4 Sheet2 +
Step by Step Solution
There are 3 Steps involved in it

Get step-by-step solutions from verified subject matter experts