

Question: Please answer questions on the bottom 1 2 3 4 5 6 7 8 A Obs 1 2 3 4 5 6 7 8 9
Please answer questions on the bottom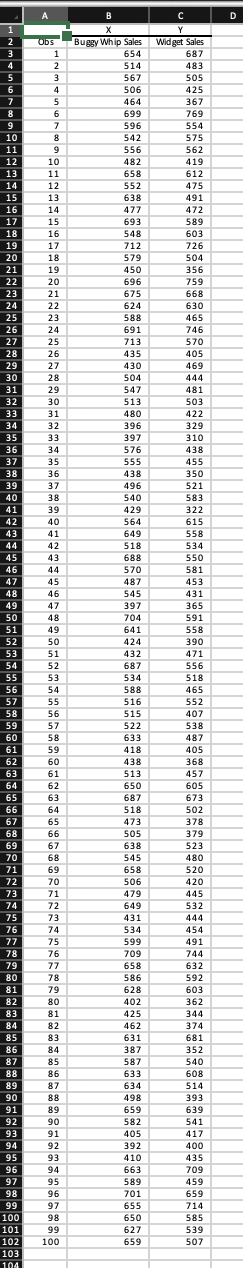
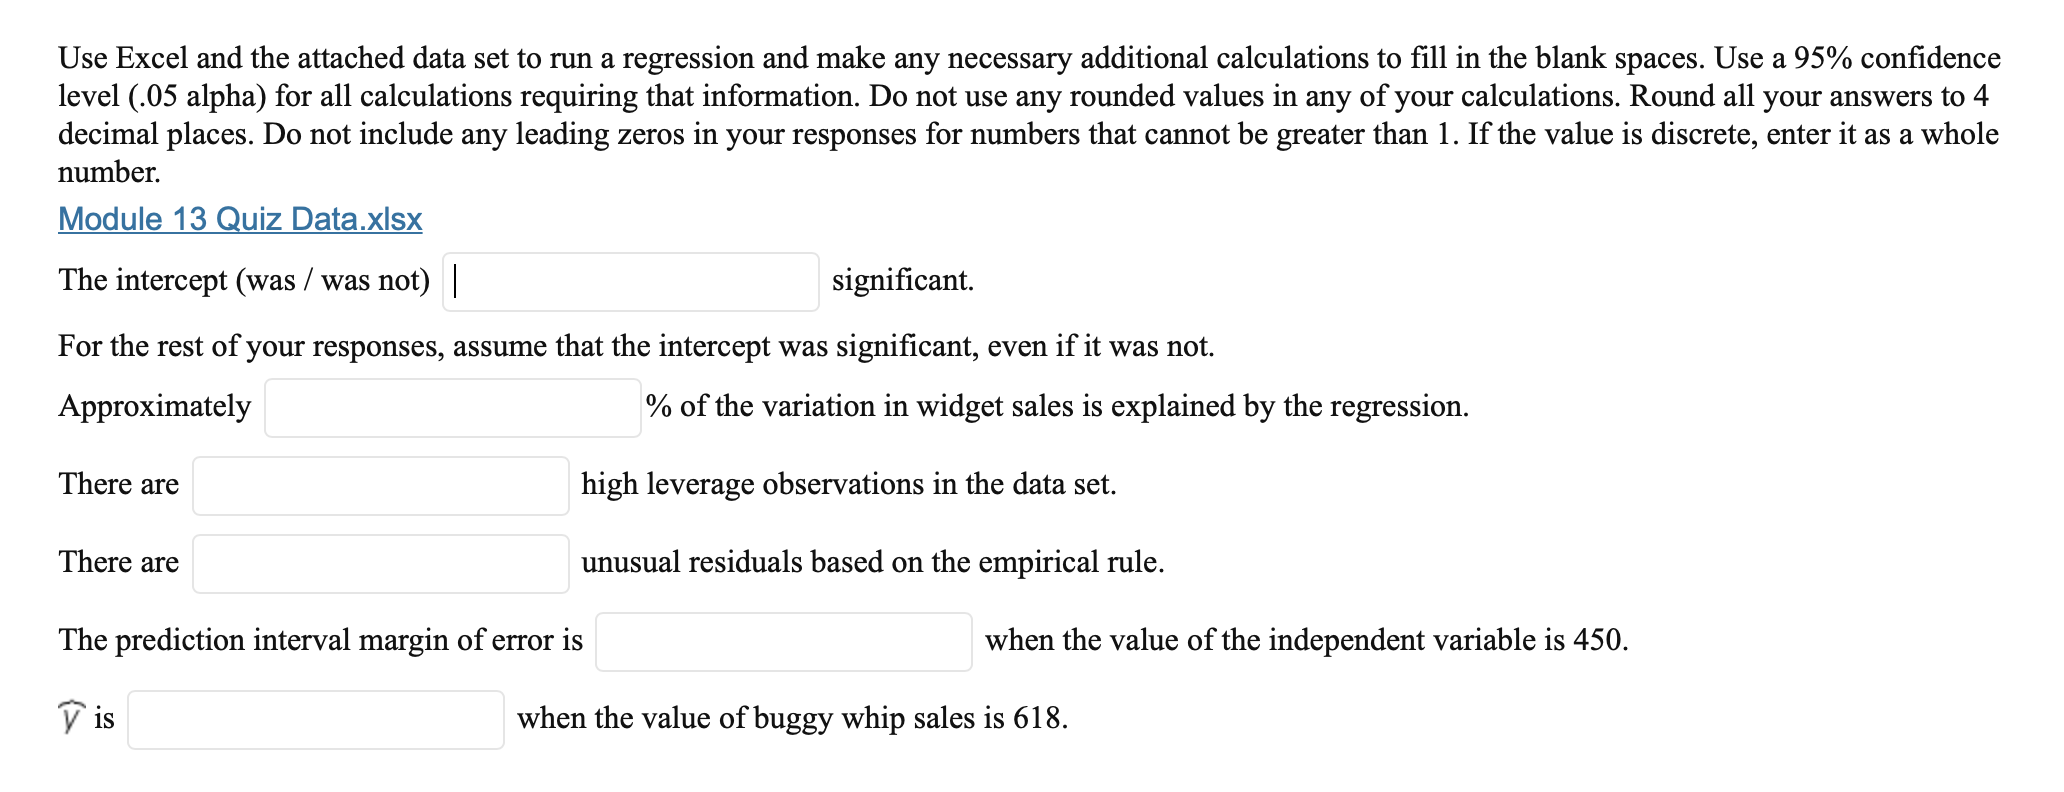
1 2 3 4 5 6 7 8 A Obs 1 2 3 4 5 6 7 8 9 9 10 11 12 10 13 11 14 12 15 13 16 14 17 15 18 16 19 17 20 18 21 19 22 20 23 21 24 22 25 23 26 24 27 25 28 26 29 27 30 28 31 29 32 30 33 31 34 32 35 33 36 34 37 35 38 36 39 37 40 38 41 39 42 40 43 41 44 42 45 43 46 44 47 45 48 46 49 47 50 48 51 49 52 50 53 51 54 52 55 53 56 54 57 55 58 56 59 57 60 58 61 59 62 60 63 61 64 62 65 63 66 64 67 65 68 66 69 67 70 68 71 69 72 70 73 71 74 72 75 73 76 74 77 75 78 76 79 77 80 78 81 79 82 80 83 81 84 82 85 83 86 84 87 85 88 86 89 87 90 88 91 89 92 90 93 91 94 92 95 93 96 94 97 95 98 96 99 97 100 98 99 101 100 102 103 104 B Y Widget Sales 687 483 505 425 367 769 554 575 562 419 612 475 491 472 589 603 726 504 356 759 668 630 465 746 570 405 469 444 481 503 422 329 310 438 455 350 521 583 322 615 558 534 550 581 453 431 365 591 558 390 471 556 518 465 552 407 538 487 405 368 457 605 673 502 378 379 523 480 520 420 445 532 444 454 491 744 632 592 603 362 344 374 681 352 540 608 514 393 639 541 417 400 435 709 459 659 714 585 539 507 X Buggy Whip Sales 654 514 567 506 464 699 596 542 556 482 658 552 638 477 693 548 712 579 450 696 675 624 588 691 713 435 430 504 547 513 480 396 397 576 555 438 496 540 429 564 649 518 688 570 487 545 397 704 641 424 432 687 534 588 516 515 522 633 418 438 513 650 687 518 473 505 638 545 658 506 479 649 431 534 599 709 658 586 628 402 425 462 631 387 587 633 634 498 659 582 405 392 410 663 589 701 655 650 627 659 D Use Excel and the attached data set to run a regression and make any necessary additional calculations to fill in the blank spaces. Use a 95% confidence level (.05 alpha) for all calculations requiring that information. Do not use any rounded values in any of your calculations. Round all your answers to 4 decimal places. Do not include any leading zeros in your responses for numbers that cannot be greater than 1. If the value is discrete, enter it as a whole number. Module 13 Quiz Data.xlsx The intercept (was / was not) | significant. For the rest of your responses, assume that the intercept was significant, even if it was not. Approximately % of the variation in widget sales is explained by the regression. There are high leverage observations in the data set. There are unusual residuals based on the empirical rule. The prediction interval margin of error is y is when the value of the independent variable is 450. when the value of buggy whip sales is 618. 1 2 3 4 5 6 7 8 A Obs 1 2 3 4 5 6 7 8 9 9 10 11 12 10 13 11 14 12 15 13 16 14 17 15 18 16 19 17 20 18 21 19 22 20 23 21 24 22 25 23 26 24 27 25 28 26 29 27 30 28 31 29 32 30 33 31 34 32 35 33 36 34 37 35 38 36 39 37 40 38 41 39 42 40 43 41 44 42 45 43 46 44 47 45 48 46 49 47 50 48 51 49 52 50 53 51 54 52 55 53 56 54 57 55 58 56 59 57 60 58 61 59 62 60 63 61 64 62 65 63 66 64 67 65 68 66 69 67 70 68 71 69 72 70 73 71 74 72 75 73 76 74 77 75 78 76 79 77 80 78 81 79 82 80 83 81 84 82 85 83 86 84 87 85 88 86 89 87 90 88 91 89 92 90 93 91 94 92 95 93 96 94 97 95 98 96 99 97 100 98 99 101 100 102 103 104 B Y Widget Sales 687 483 505 425 367 769 554 575 562 419 612 475 491 472 589 603 726 504 356 759 668 630 465 746 570 405 469 444 481 503 422 329 310 438 455 350 521 583 322 615 558 534 550 581 453 431 365 591 558 390 471 556 518 465 552 407 538 487 405 368 457 605 673 502 378 379 523 480 520 420 445 532 444 454 491 744 632 592 603 362 344 374 681 352 540 608 514 393 639 541 417 400 435 709 459 659 714 585 539 507 X Buggy Whip Sales 654 514 567 506 464 699 596 542 556 482 658 552 638 477 693 548 712 579 450 696 675 624 588 691 713 435 430 504 547 513 480 396 397 576 555 438 496 540 429 564 649 518 688 570 487 545 397 704 641 424 432 687 534 588 516 515 522 633 418 438 513 650 687 518 473 505 638 545 658 506 479 649 431 534 599 709 658 586 628 402 425 462 631 387 587 633 634 498 659 582 405 392 410 663 589 701 655 650 627 659 D Use Excel and the attached data set to run a regression and make any necessary additional calculations to fill in the blank spaces. Use a 95% confidence level (.05 alpha) for all calculations requiring that information. Do not use any rounded values in any of your calculations. Round all your answers to 4 decimal places. Do not include any leading zeros in your responses for numbers that cannot be greater than 1. If the value is discrete, enter it as a whole number. Module 13 Quiz Data.xlsx The intercept (was / was not) | significant. For the rest of your responses, assume that the intercept was significant, even if it was not. Approximately % of the variation in widget sales is explained by the regression. There are high leverage observations in the data set. There are unusual residuals based on the empirical rule. The prediction interval margin of error is y is when the value of the independent variable is 450. when the value of buggy whip sales is 618
Step by Step Solution
There are 3 Steps involved in it

Get step-by-step solutions from verified subject matter experts