

Question: Please answer quick The graph shows potential energy (in J) vs. position (in m) for an object moving along the x- axis. The mechanical energy
Please answer quick
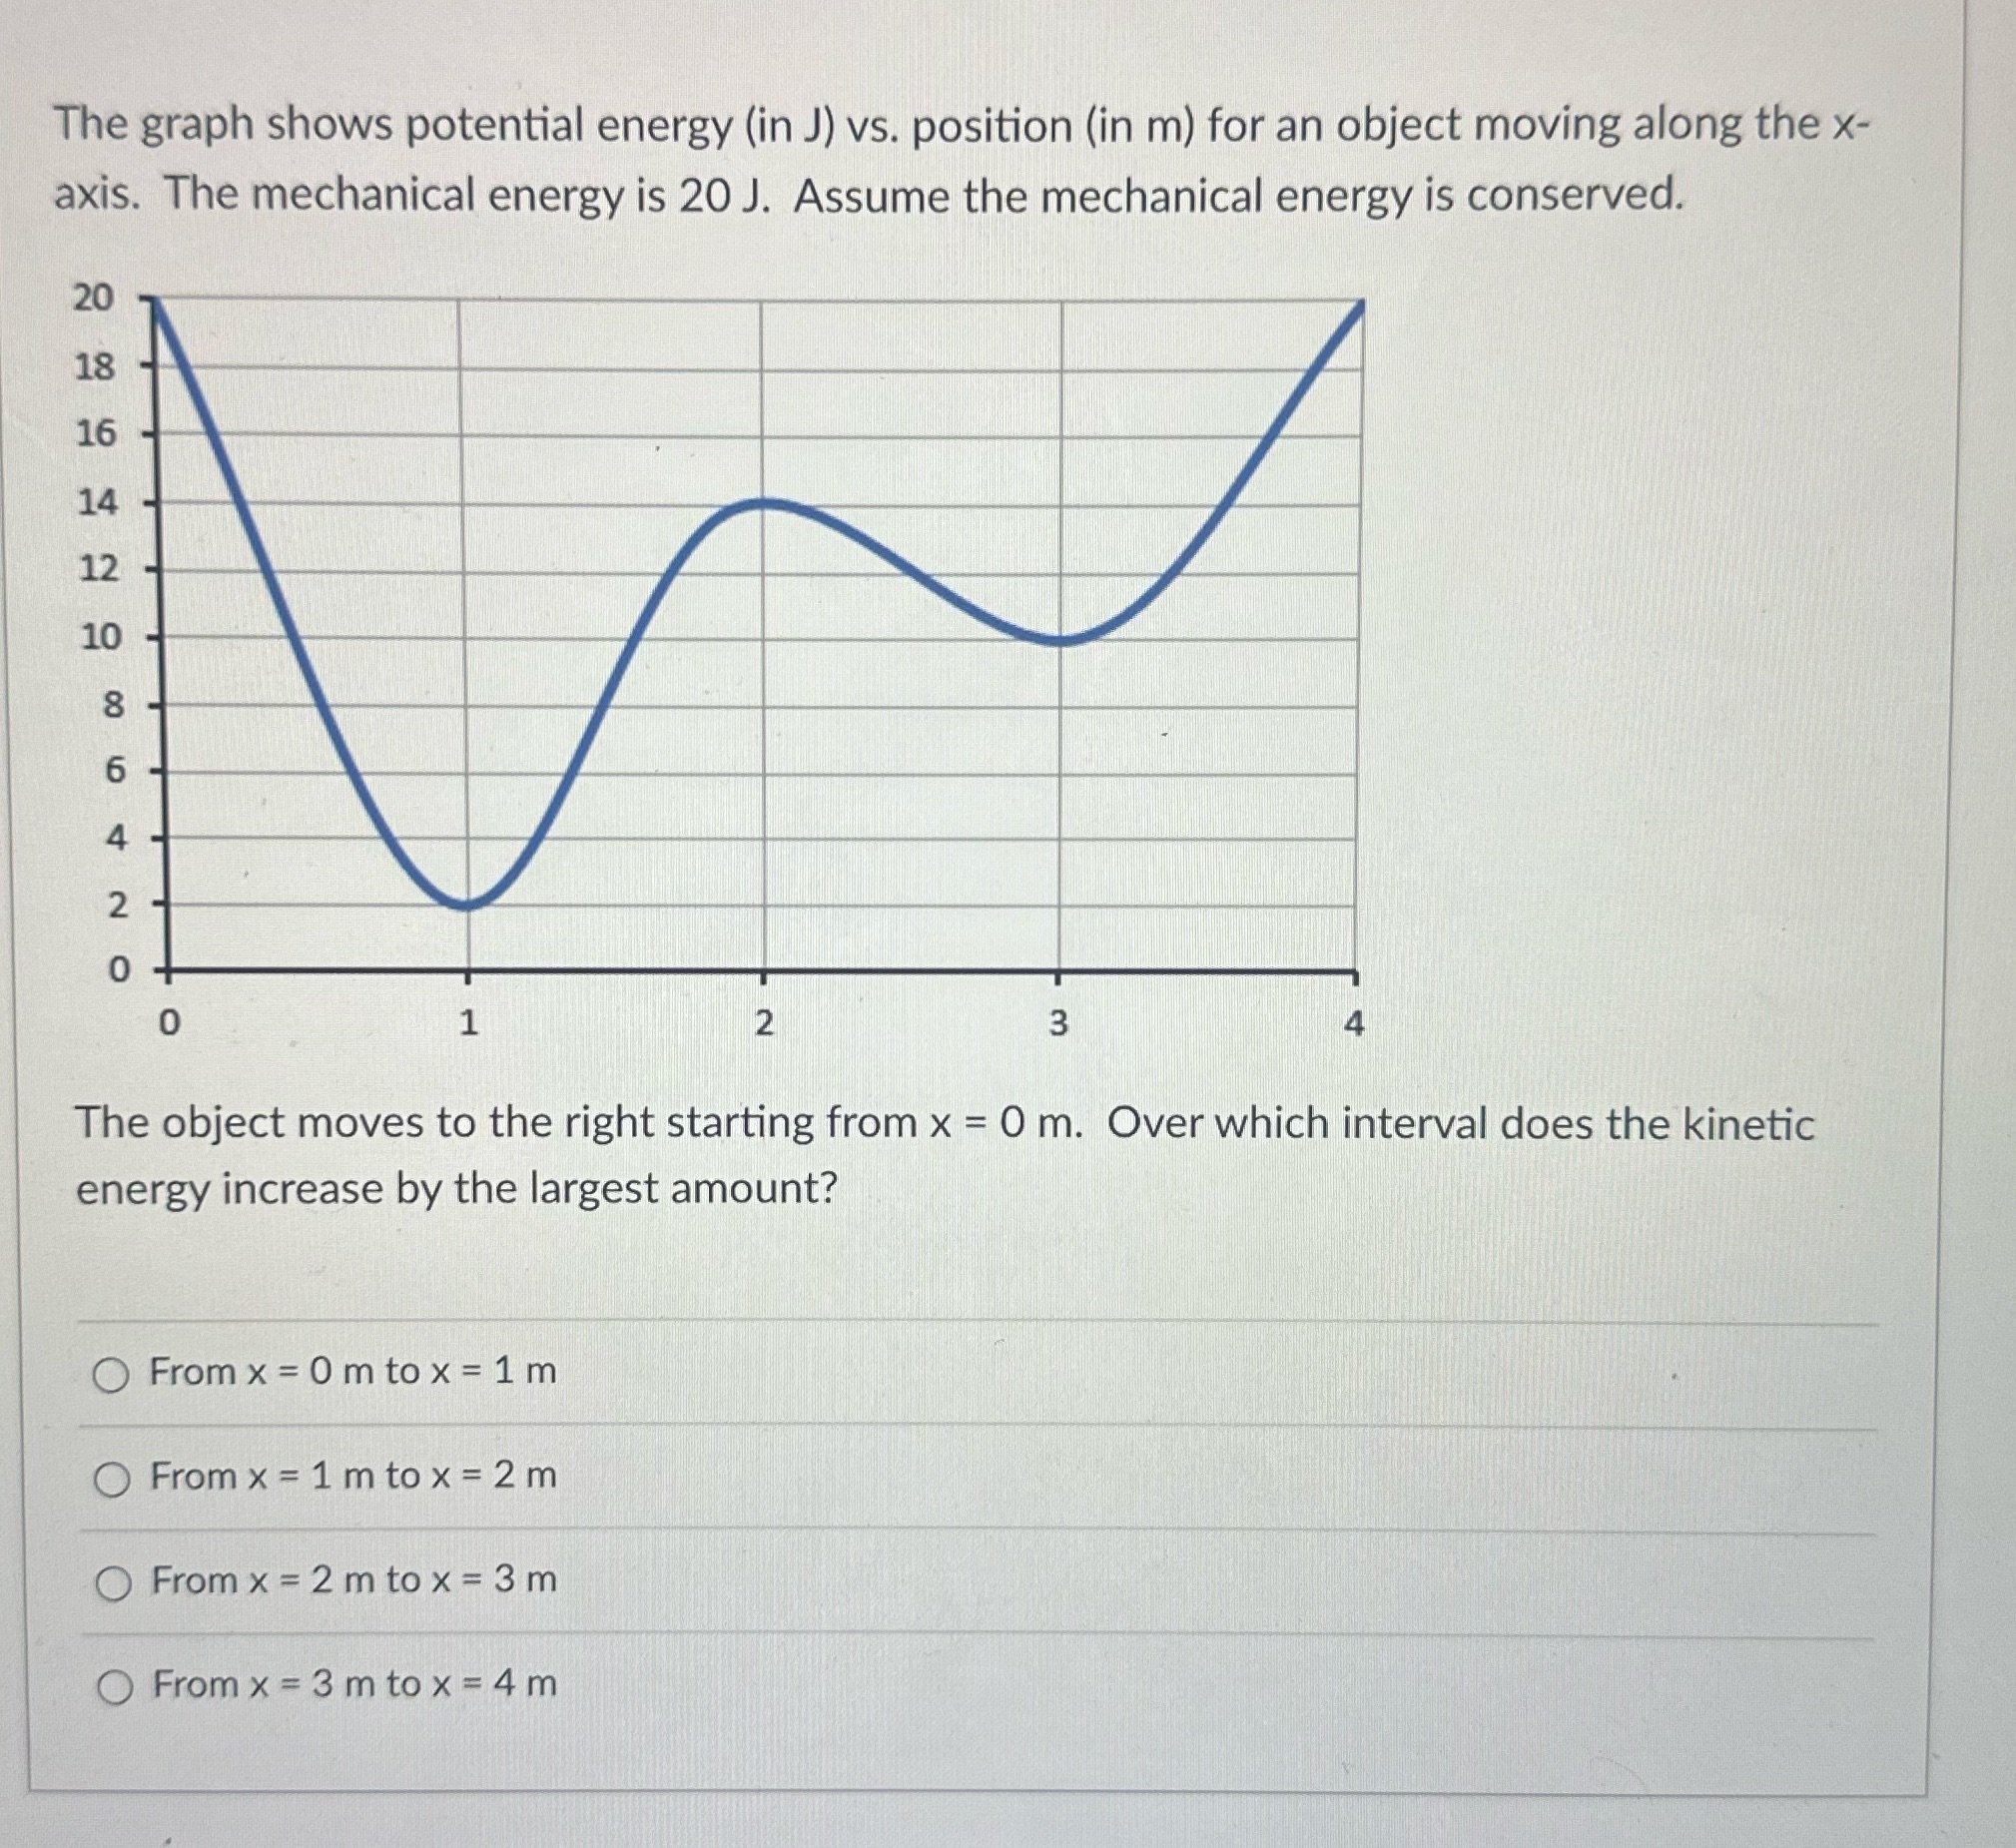
The graph shows potential energy (in J) vs. position (in m) for an object moving along the x- axis. The mechanical energy is 20 J. Assume the mechanical energy is conserved. 20 18 16 14 12 10 N 2 3 The object moves to the right starting from x = 0 m. Over which interval does the kinetic energy increase by the largest amount? From x = 0m to x = 1m From x = 1 m to x = 2m From x = 2 m to x = 3m From x = 3 m to x = 4m
Step by Step Solution
There are 3 Steps involved in it
1 Expert Approved Answer
Step: 1 Unlock

Question Has Been Solved by an Expert!
Get step-by-step solutions from verified subject matter experts
Step: 2 Unlock
Step: 3 Unlock