

Question: please answer quickly thank you for the help in advance (: Graph the following data Temperature (c)(x axis) Pressure (torr) (y axis) 0 550 25
 please answer quickly thank you for the help in advance (:
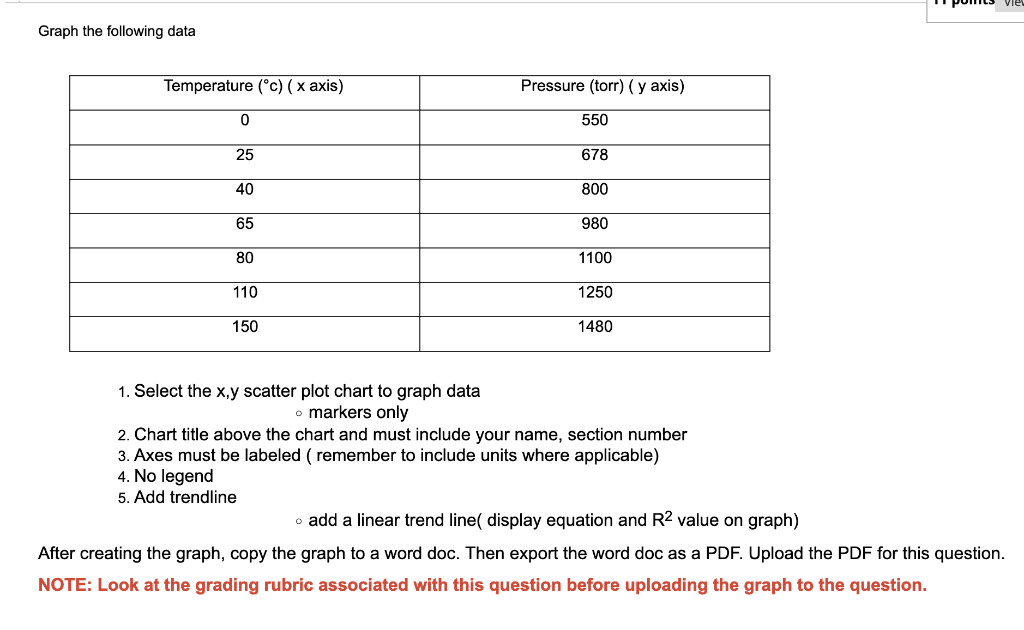
Graph the following data Temperature (c)(x axis) Pressure (torr) (y axis) 0 550 25 678 40 800 65 980 80 1100 110 1250 150 1480 1. Select the x,y scatter plot chart to graph data markers only 2. Chart title above the chart and must include your name, section number 3. Axes must be labeled ( remember to include units where applicable) 4. No legend 5. Add trendline add a linear trend line( display equation and R2 value on graph) After creating the graph, copy the graph to a word doc. Then export the word doc as a PDF. Upload the PDF for this question. NOTE: Look at the grading rubric associated with this question before uploading the graph to the
Step by Step Solution
There are 3 Steps involved in it

Get step-by-step solutions from verified subject matter experts