

Question: please answer soon thank you! For the test errors, the c-chart with control limits that contain 9973% of the random variation in test scores is
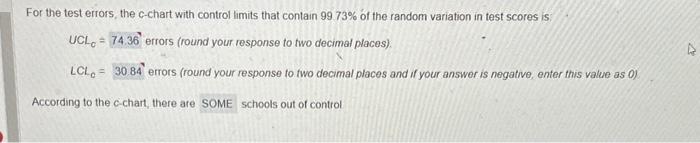
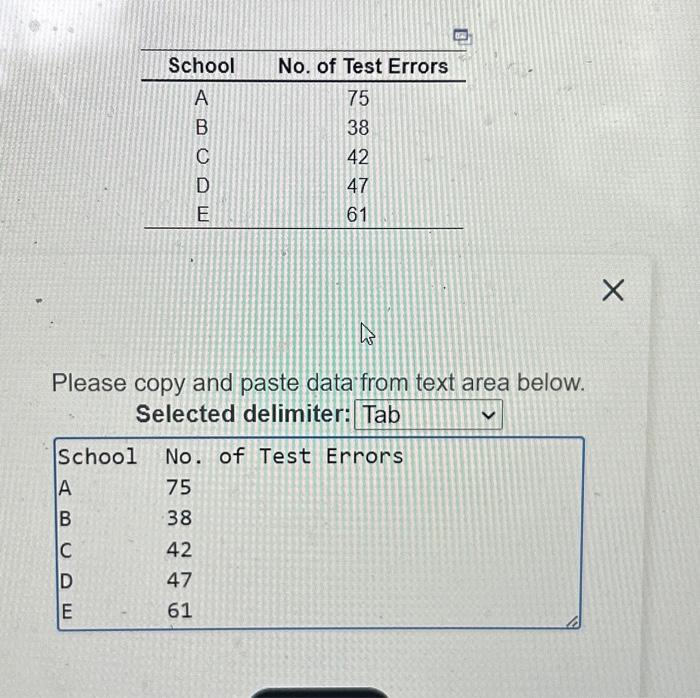
For the test errors, the c-chart with control limits that contain 9973% of the random variation in test scores is UCLc=74.36 errors (round your response to two decimal places). LClC=30.84 errors (round your response to fwo decimal places and if your answer is negative, enter this value as 0 ). According to the c-chart, there are schools out of control Please copy and paste data from text area below. Selected delimiter: For the test errors, the c-chart with control limits that contain 9973% of the random variation in test scores is UCLc=74.36 errors (round your response to two decimal places). LClC=30.84 errors (round your response to fwo decimal places and if your answer is negative, enter this value as 0 ). According to the c-chart, there are schools out of control Please copy and paste data from text area below. Selected delimiter
Step by Step Solution
There are 3 Steps involved in it

Get step-by-step solutions from verified subject matter experts