

Question: Please answer. Thank you Tutor! Q4 WEEKS The table below shows the number of hours spend in studying and final exam score of 10 students.
Please answer. Thank you Tutor!
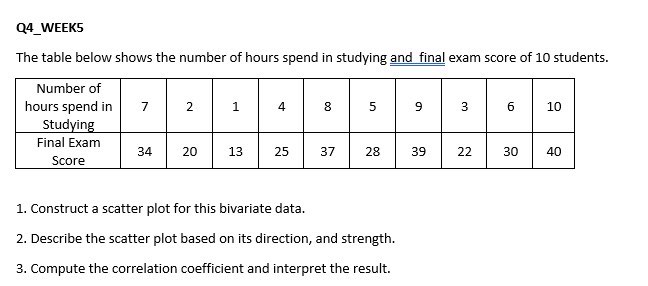
Q4 WEEKS The table below shows the number of hours spend in studying and final exam score of 10 students. Number of hours spend in 7 2 1 4 8 5 9 3 6 10 Studying Final Exam 34 20 13 25 37 28 39 22 30 40 Score 1. Construct a scatter plot for this bivariate data. 2. Describe the scatter plot based on its direction, and strength. 3. Compute the correlation coefficient and interpret the result
Step by Step Solution
There are 3 Steps involved in it
1 Expert Approved Answer
Step: 1 Unlock

Question Has Been Solved by an Expert!
Get step-by-step solutions from verified subject matter experts
Step: 2 Unlock
Step: 3 Unlock