

Question: please answer thank you, will receive a thumbs up Suppose that you have collected the following data from a process to establish an x-chart (x-bar-
please answer thank you, will receive a thumbs up 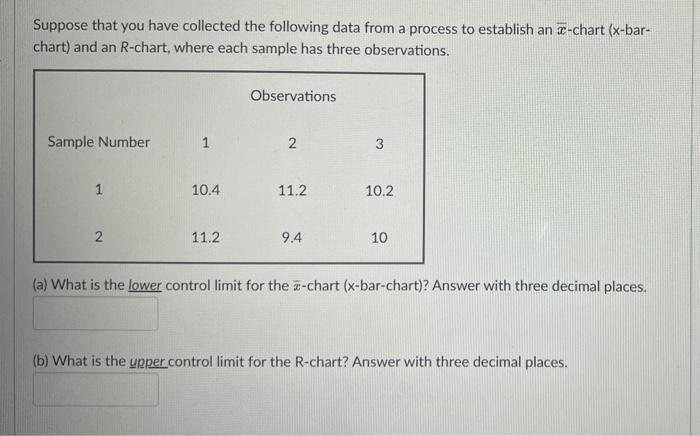
Suppose that you have collected the following data from a process to establish an x-chart (x-bar- chart) and an R-chart, where each sample has three observations. Observations Sample Number 1 2 3 1 10.4 11.2 10.2 2 11.2 9.4 10 (a) What is the lower control limit for the a-chart (x-bar-chart)? Answer with three decimal places. (b) What is the upper control limit for the R-chart? Answer with three decimal places
Step by Step Solution
There are 3 Steps involved in it
1 Expert Approved Answer
Step: 1 Unlock

Question Has Been Solved by an Expert!
Get step-by-step solutions from verified subject matter experts
Step: 2 Unlock
Step: 3 Unlock