

Question: please answer the 3 questions while showing your work. Thank you On average, which group/sex tend to have longer HALE andwhich sex's average HALE scores


please answer the 3 questions while showing your work. Thank you
- On average, which group/sex tend to have longer HALE andwhich sex's average HALE scores are more varied/spread-out compared to the other?
- Compared to normal distribution, how would you characterize the distribution of the HALE scores for each sex?
- Where does the United Kingdom's male and female HALE rank relative to other countries (find percentile ranking for each sex)?
normal distribution-
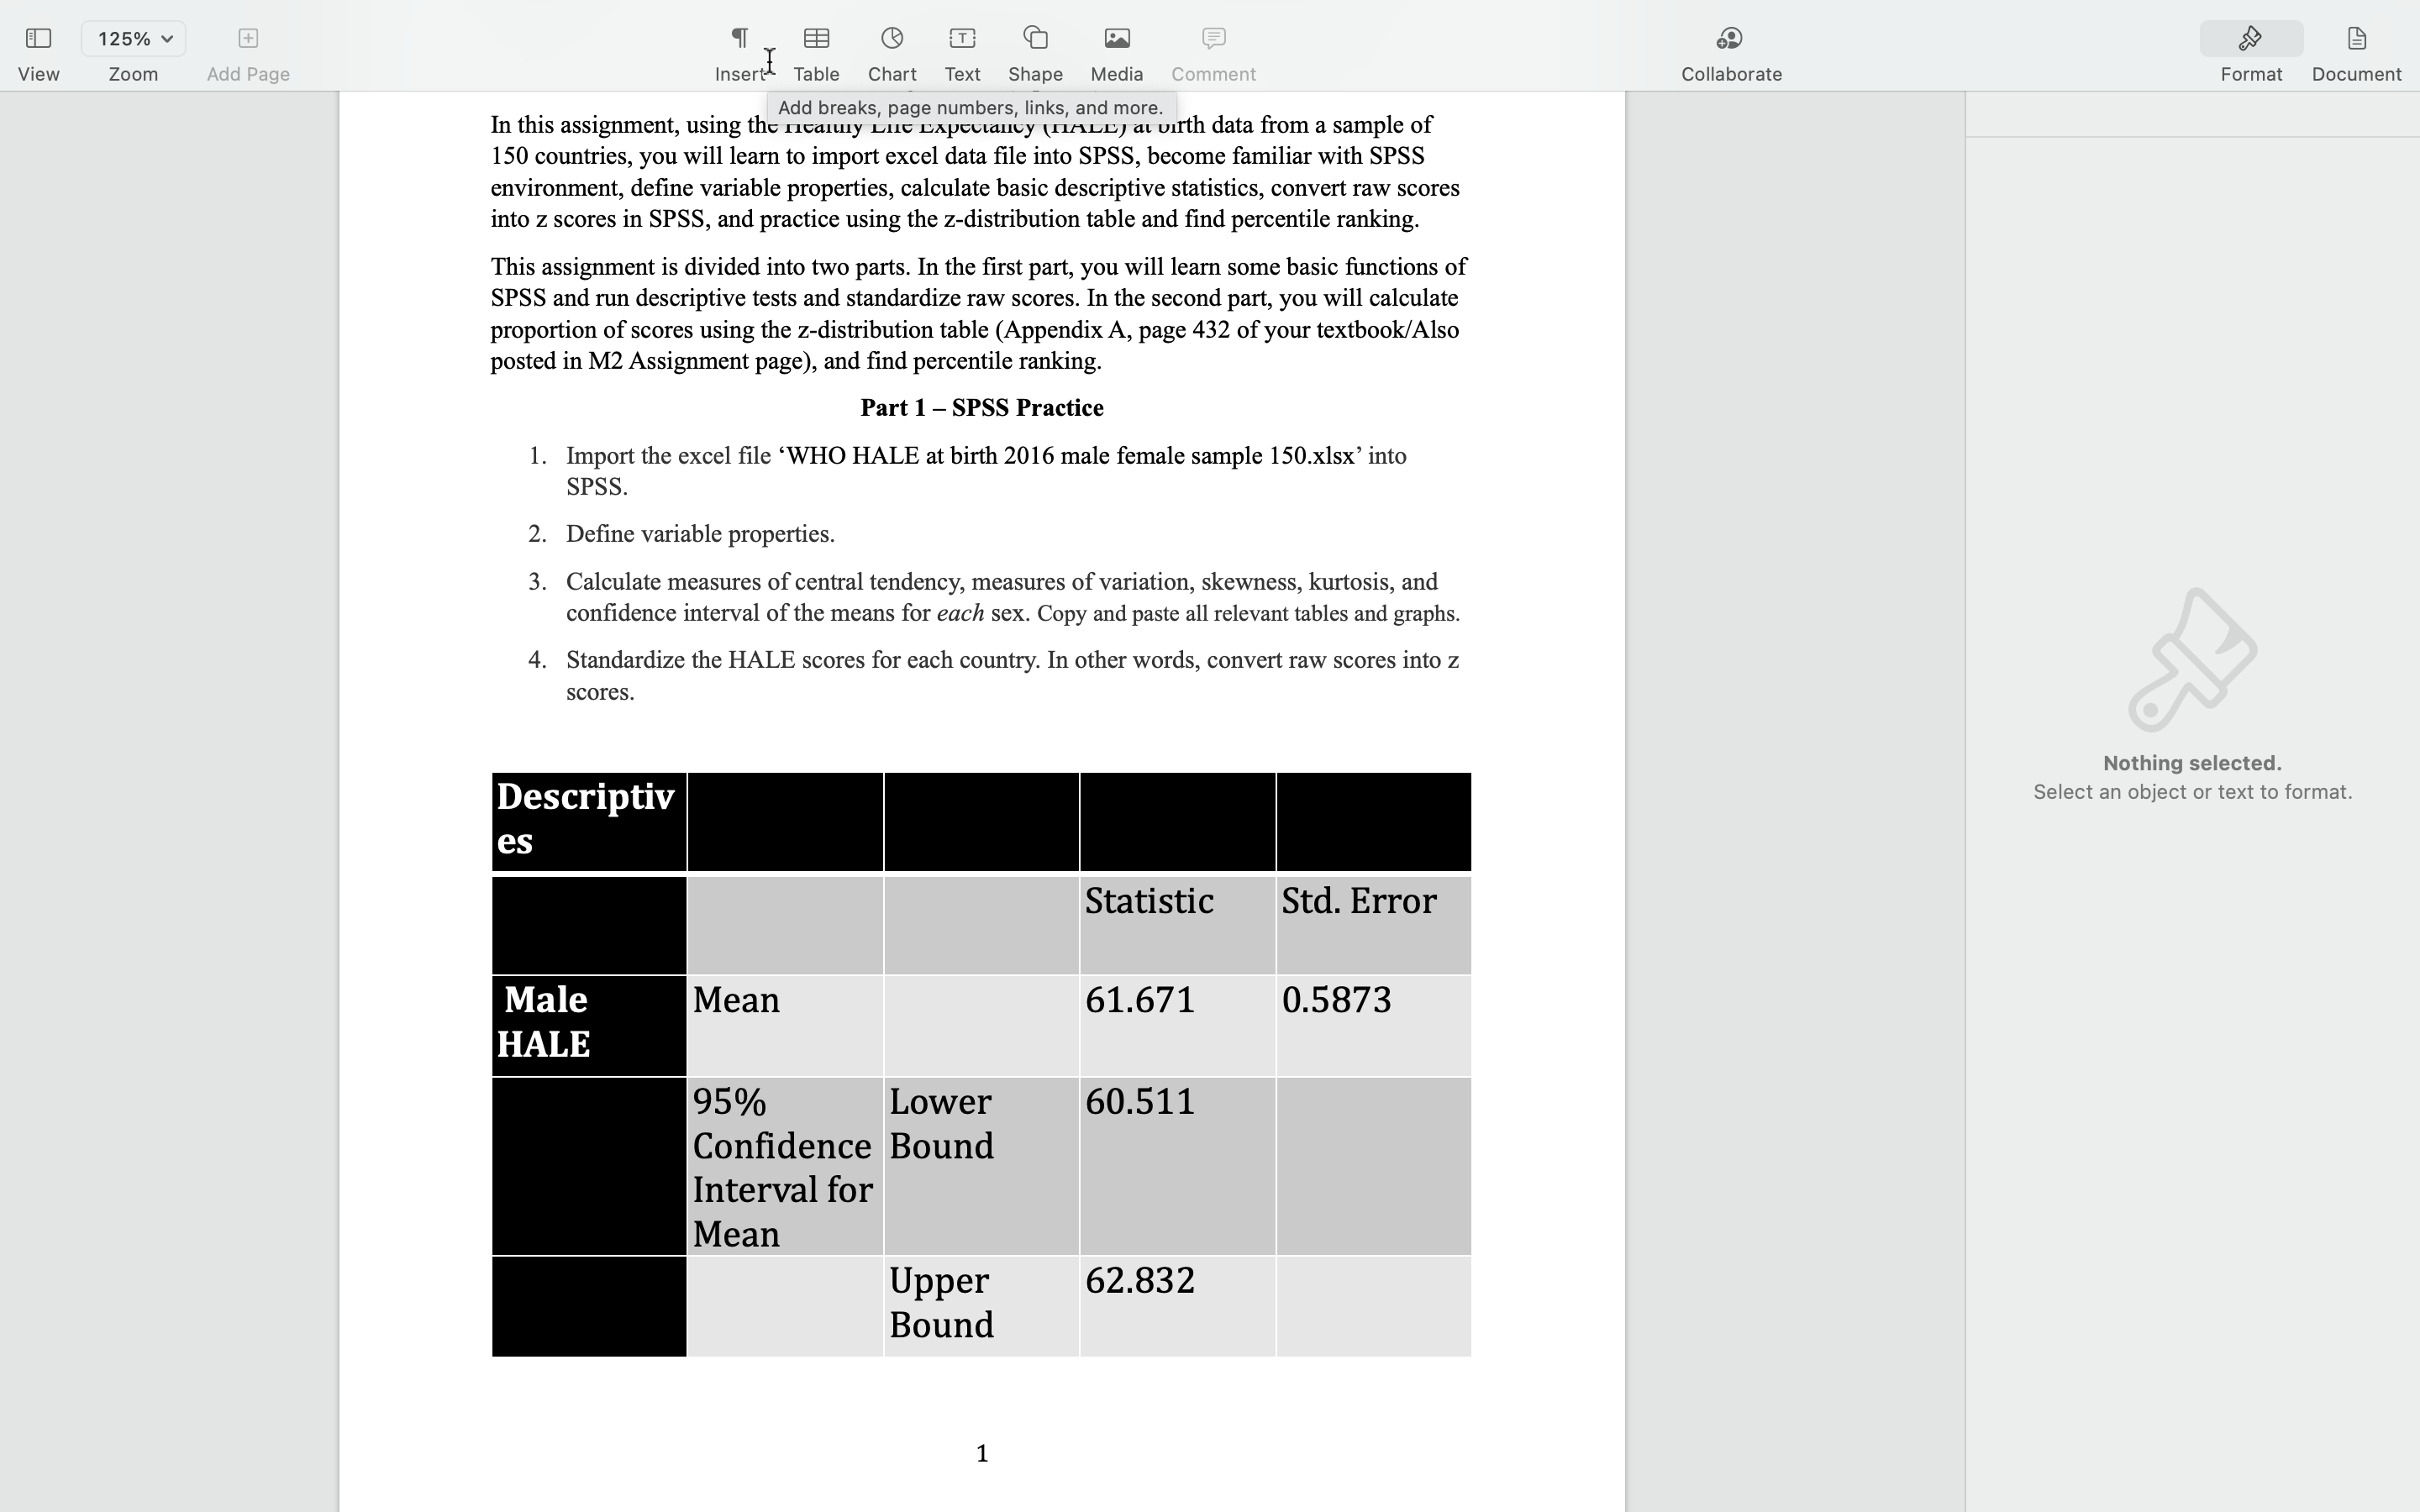
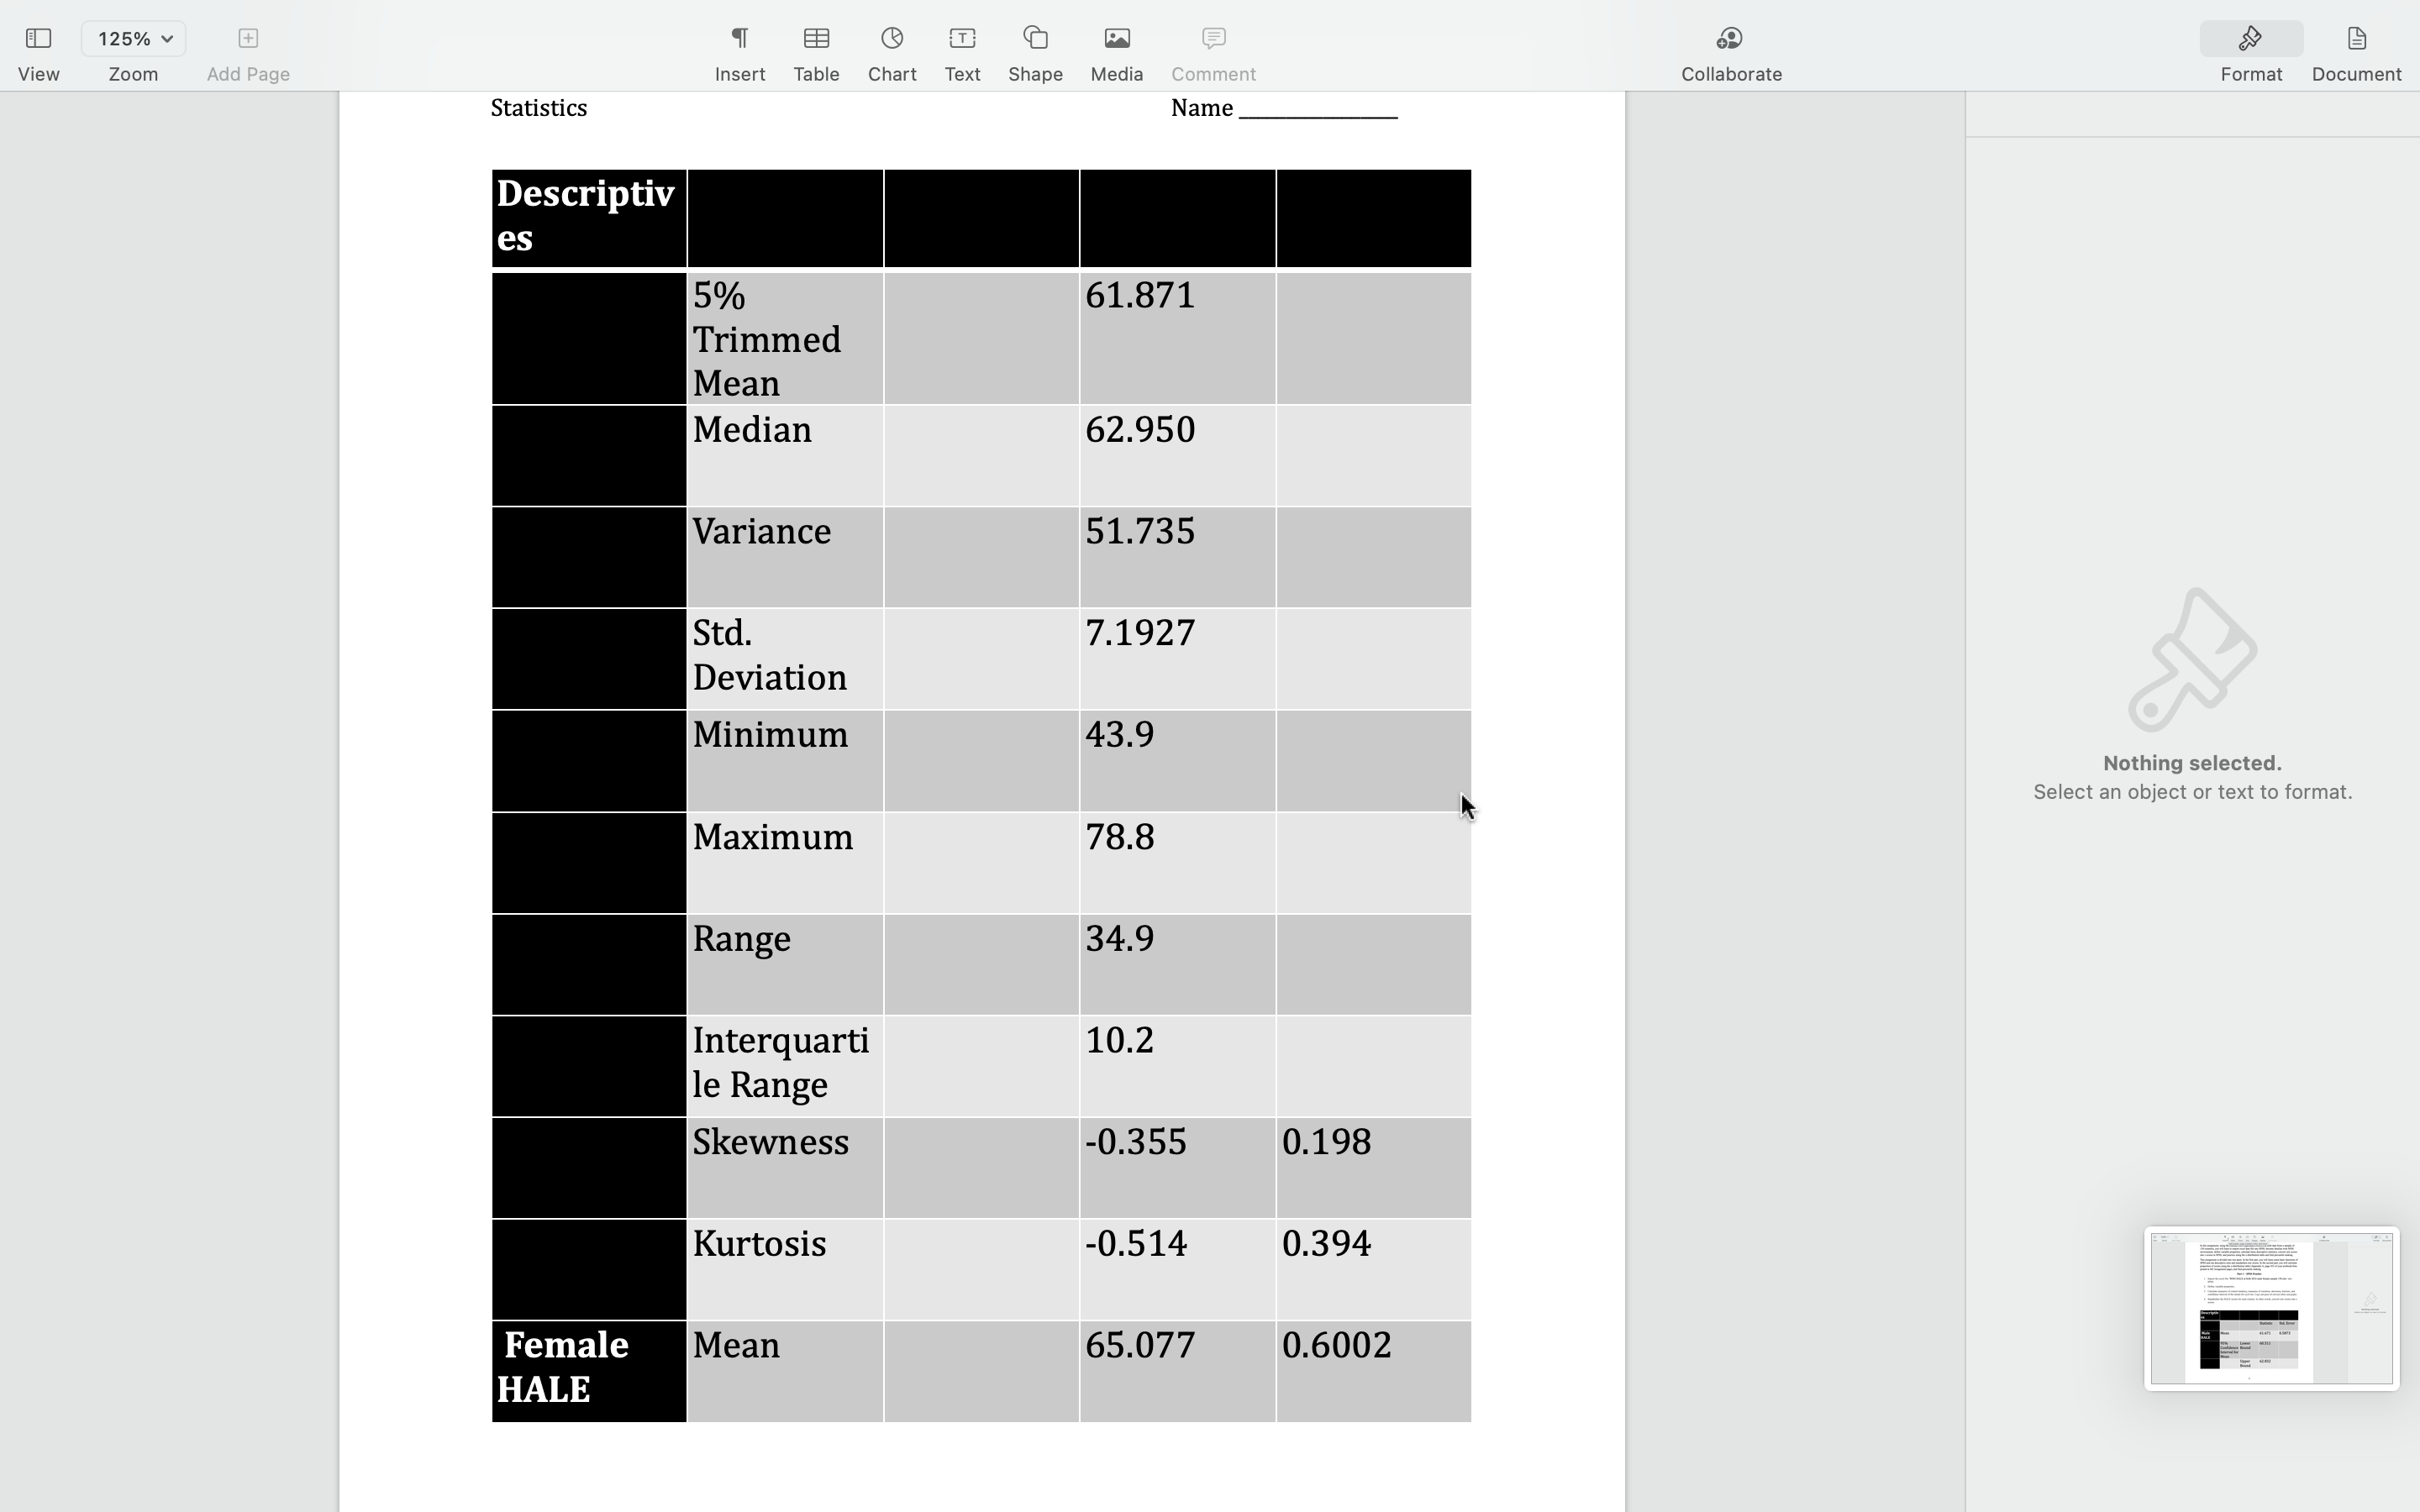
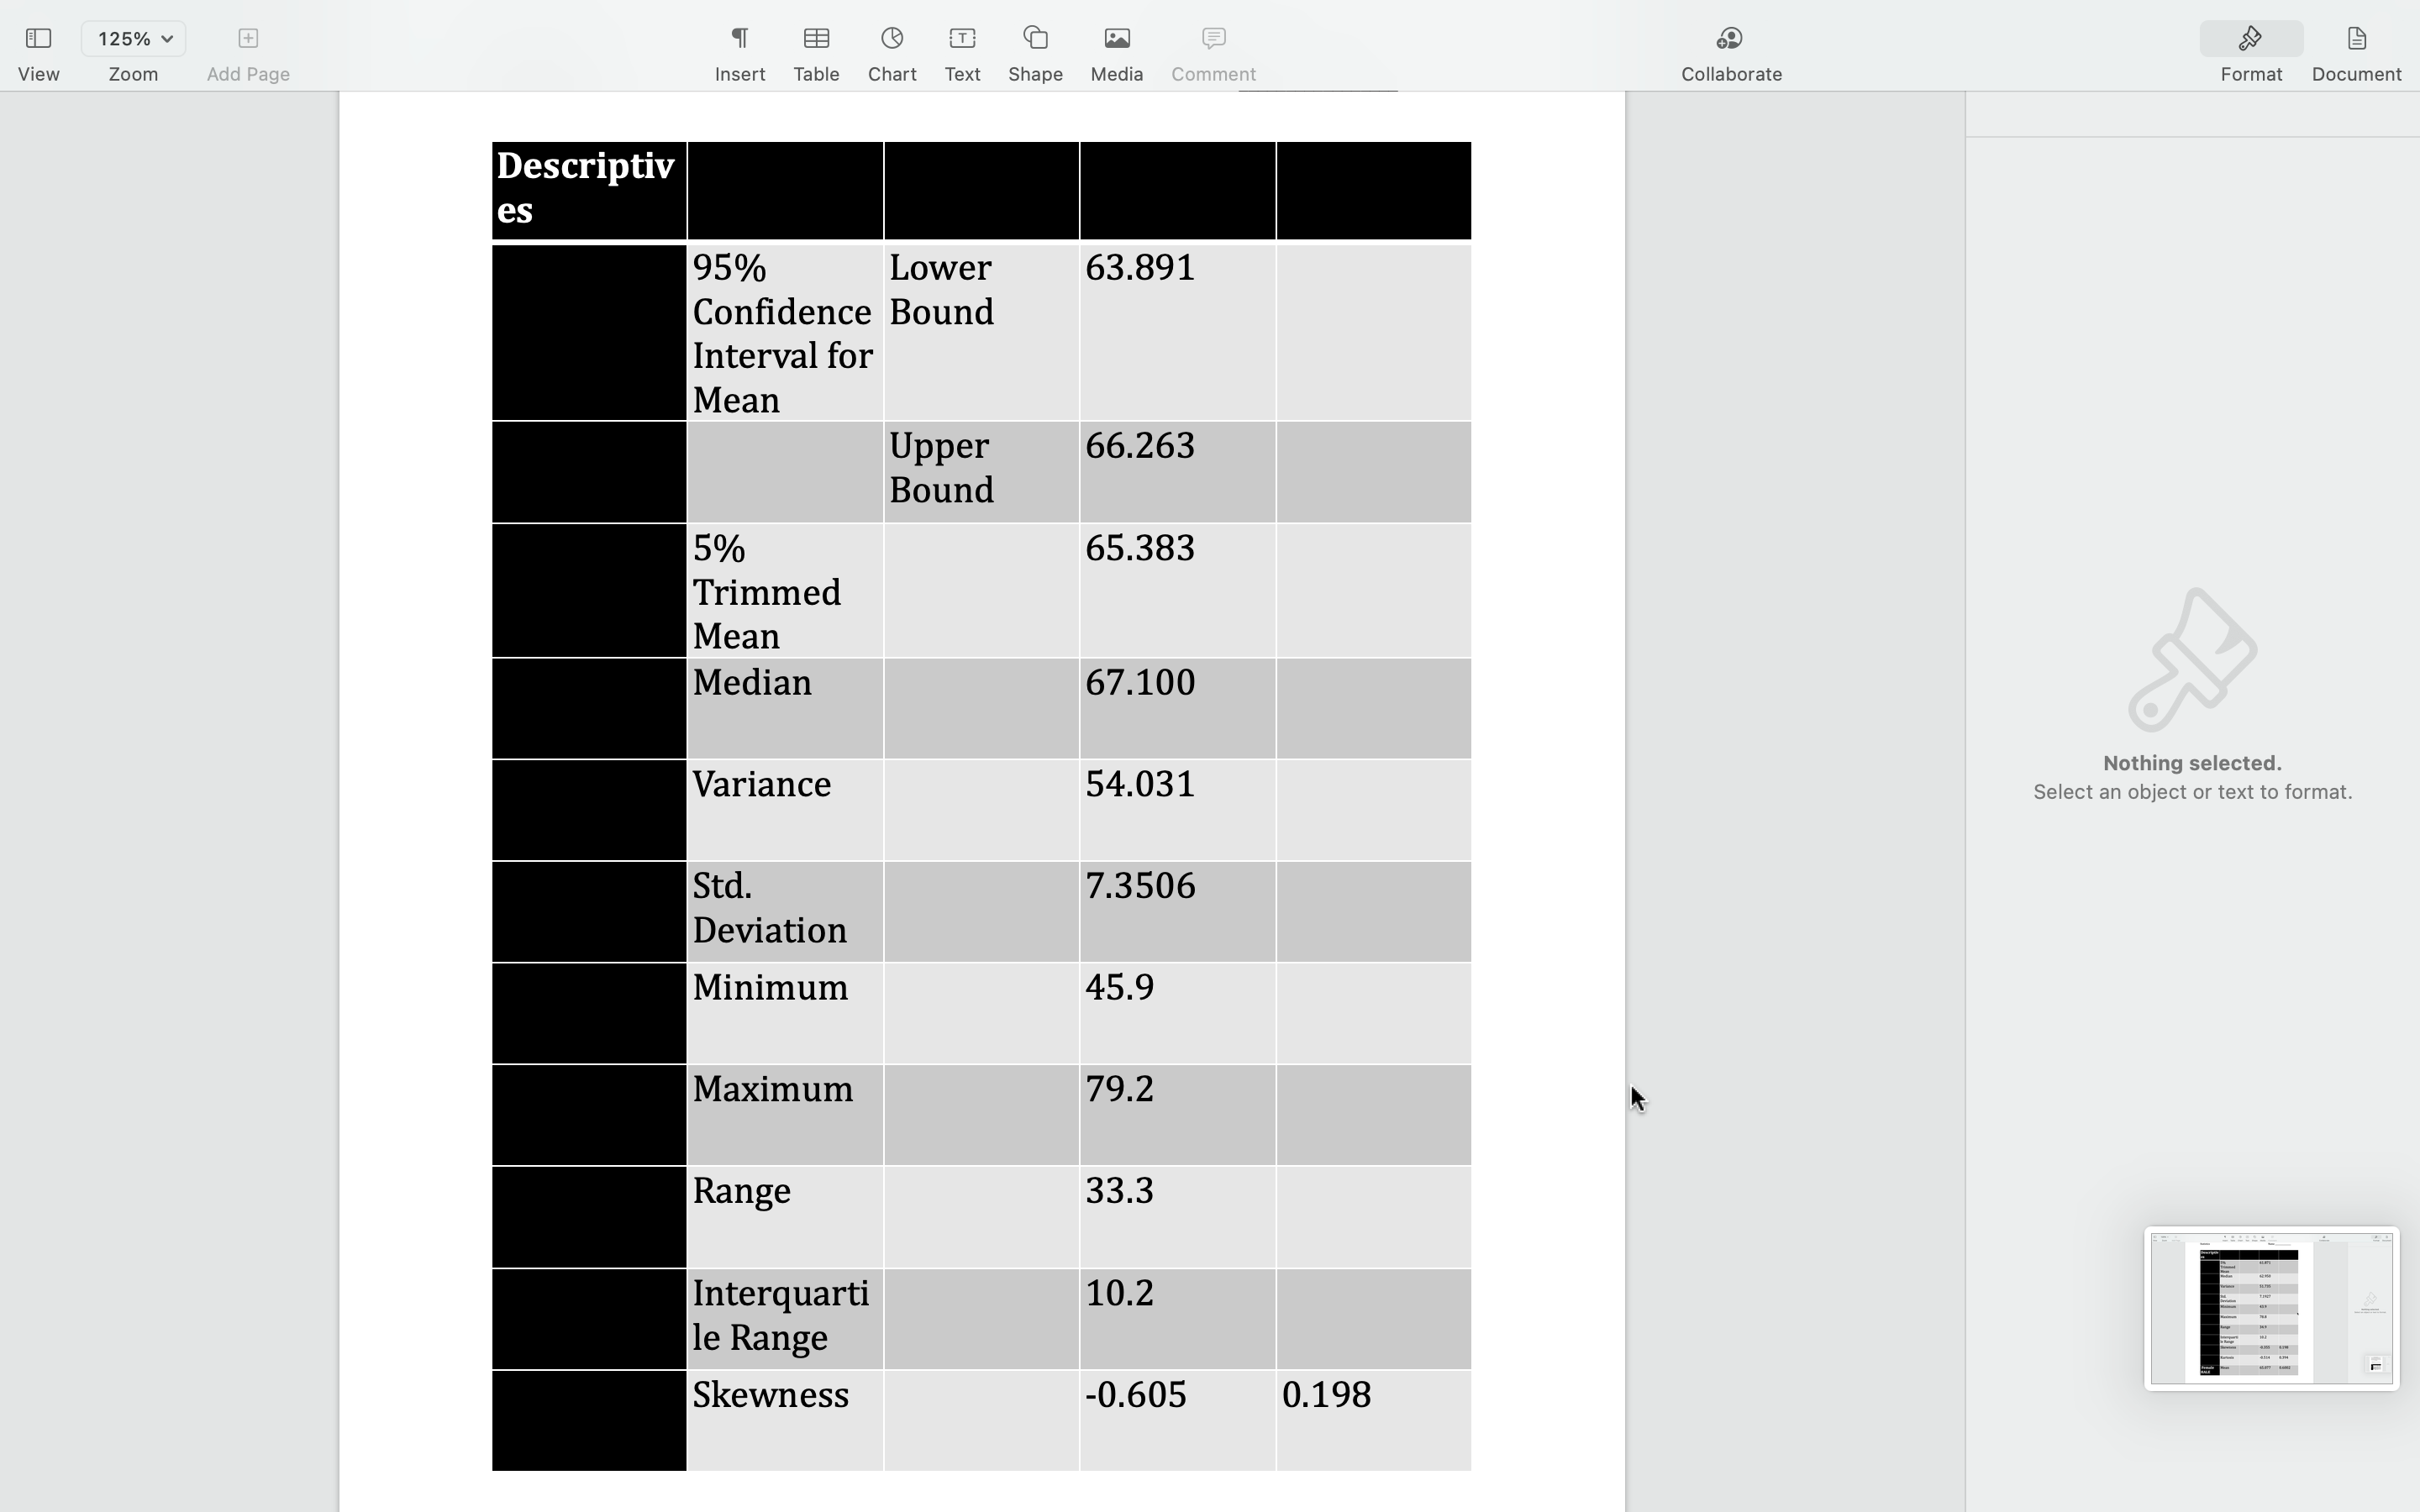
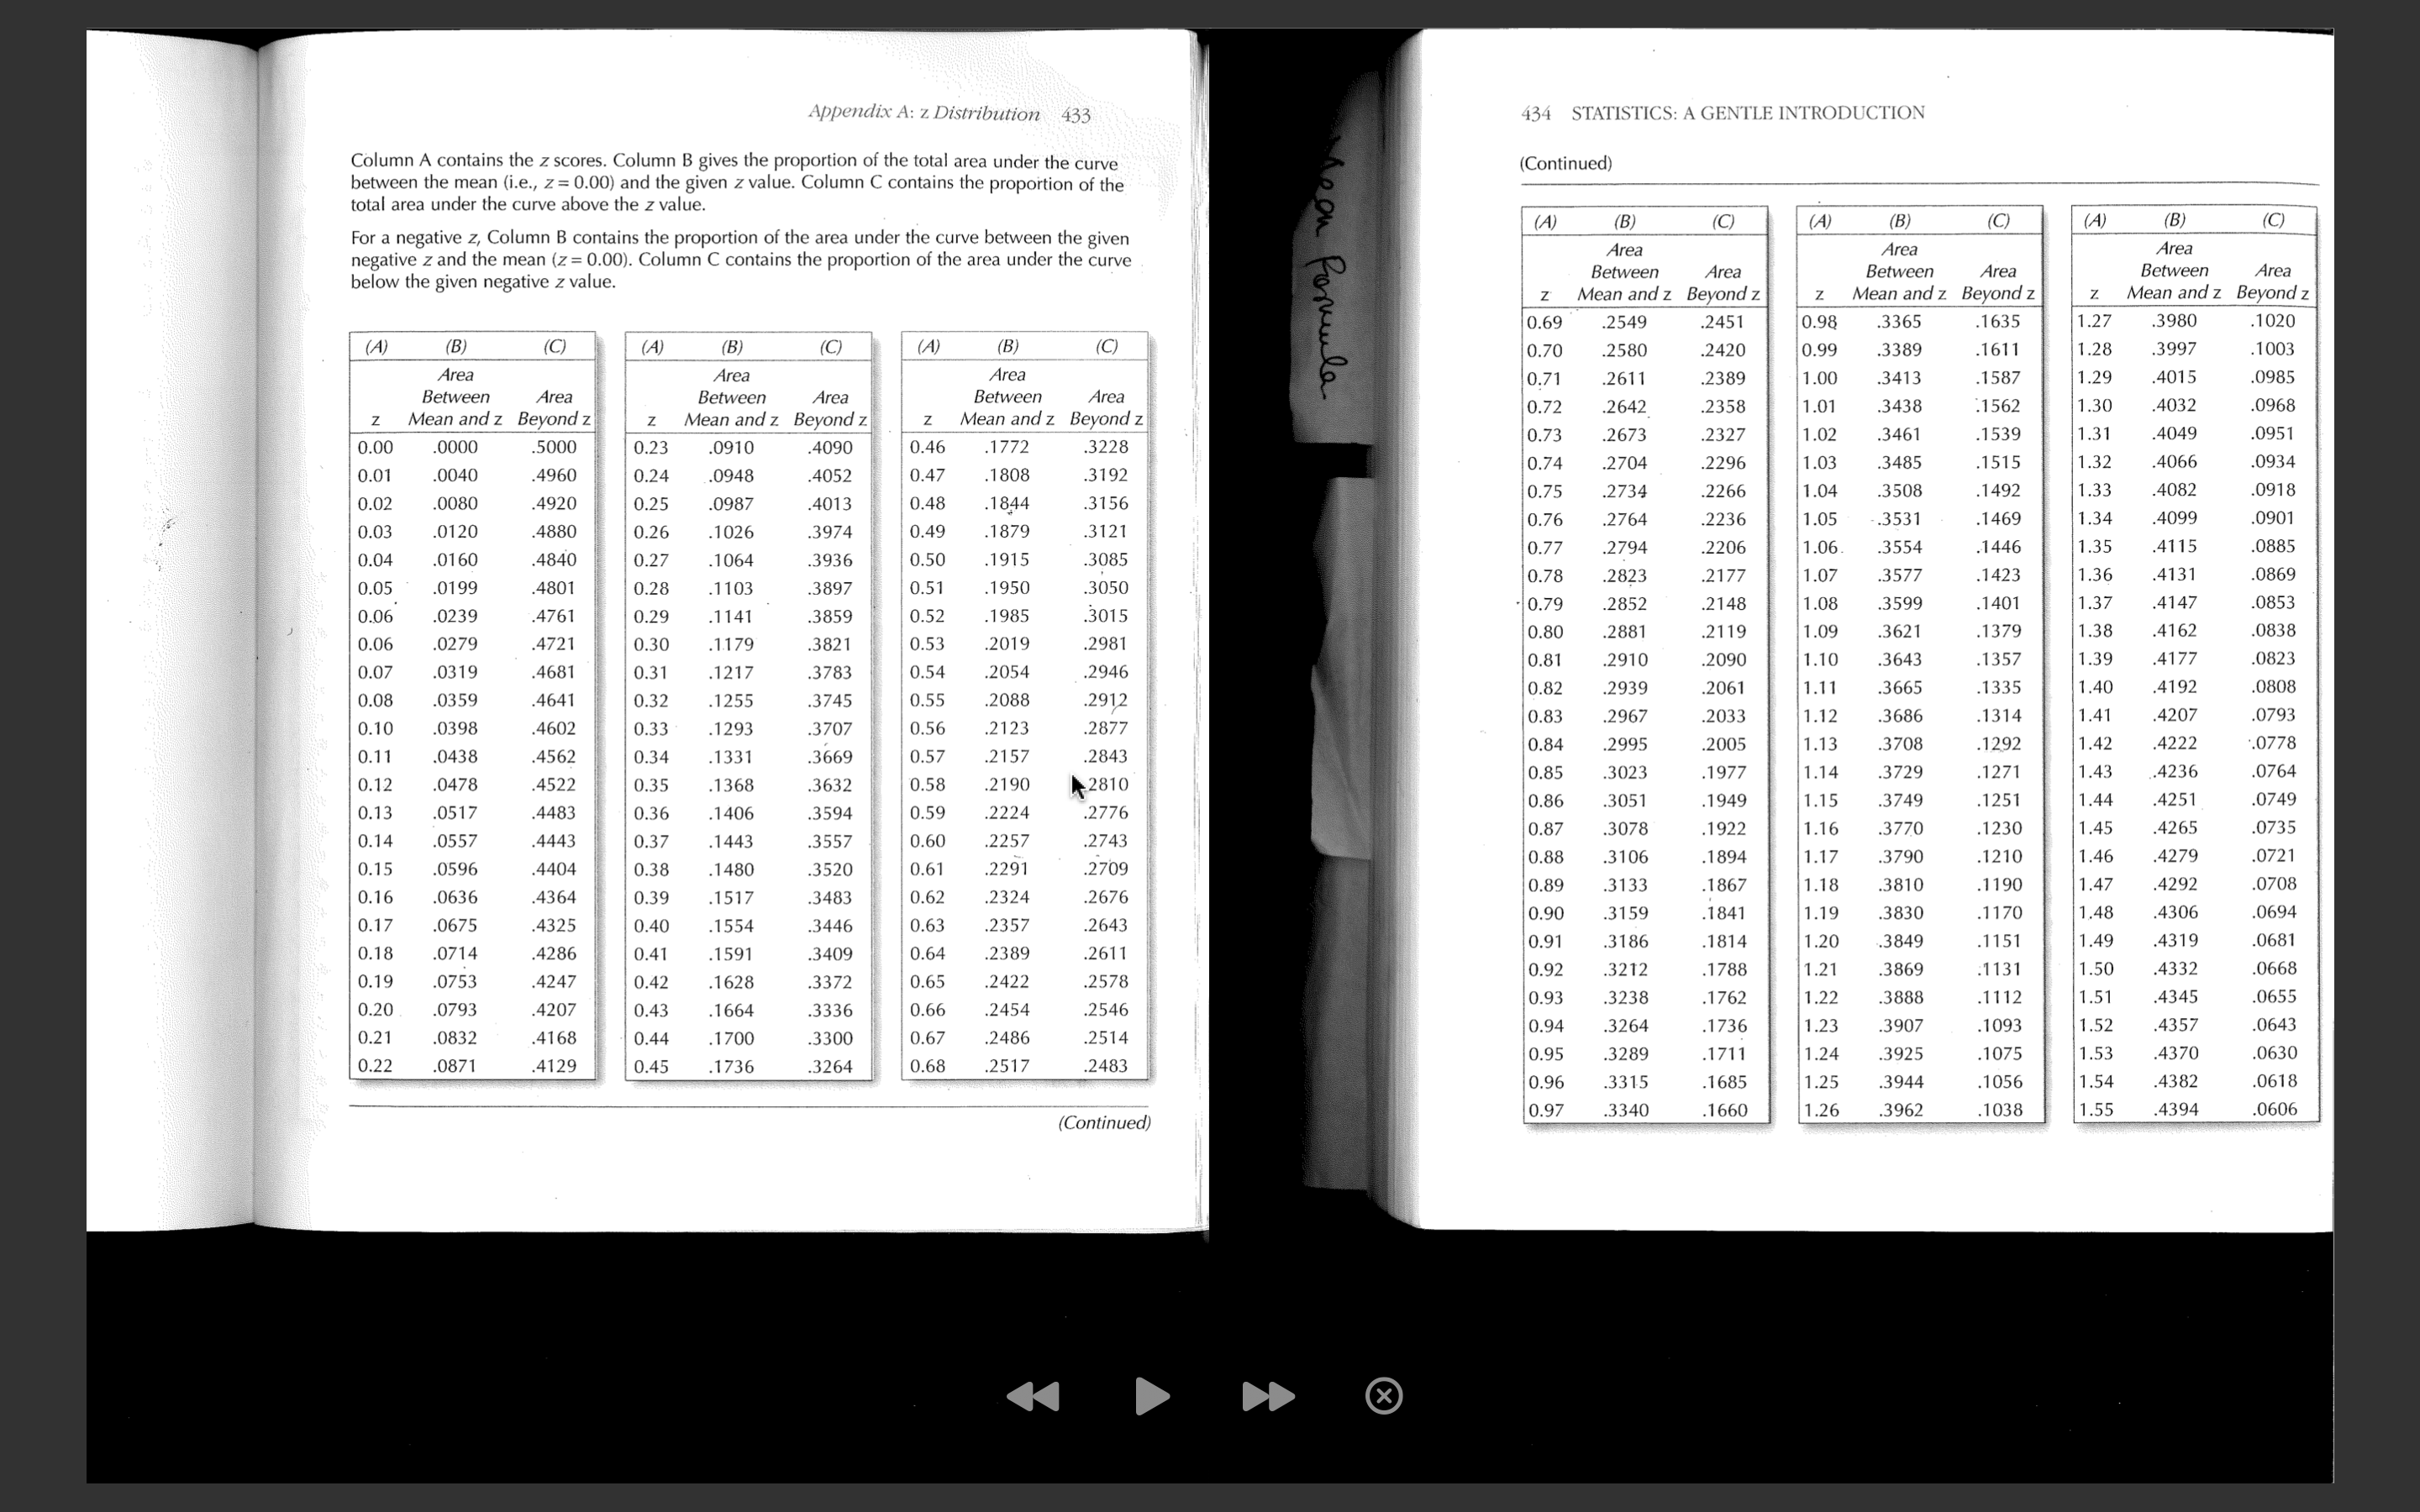
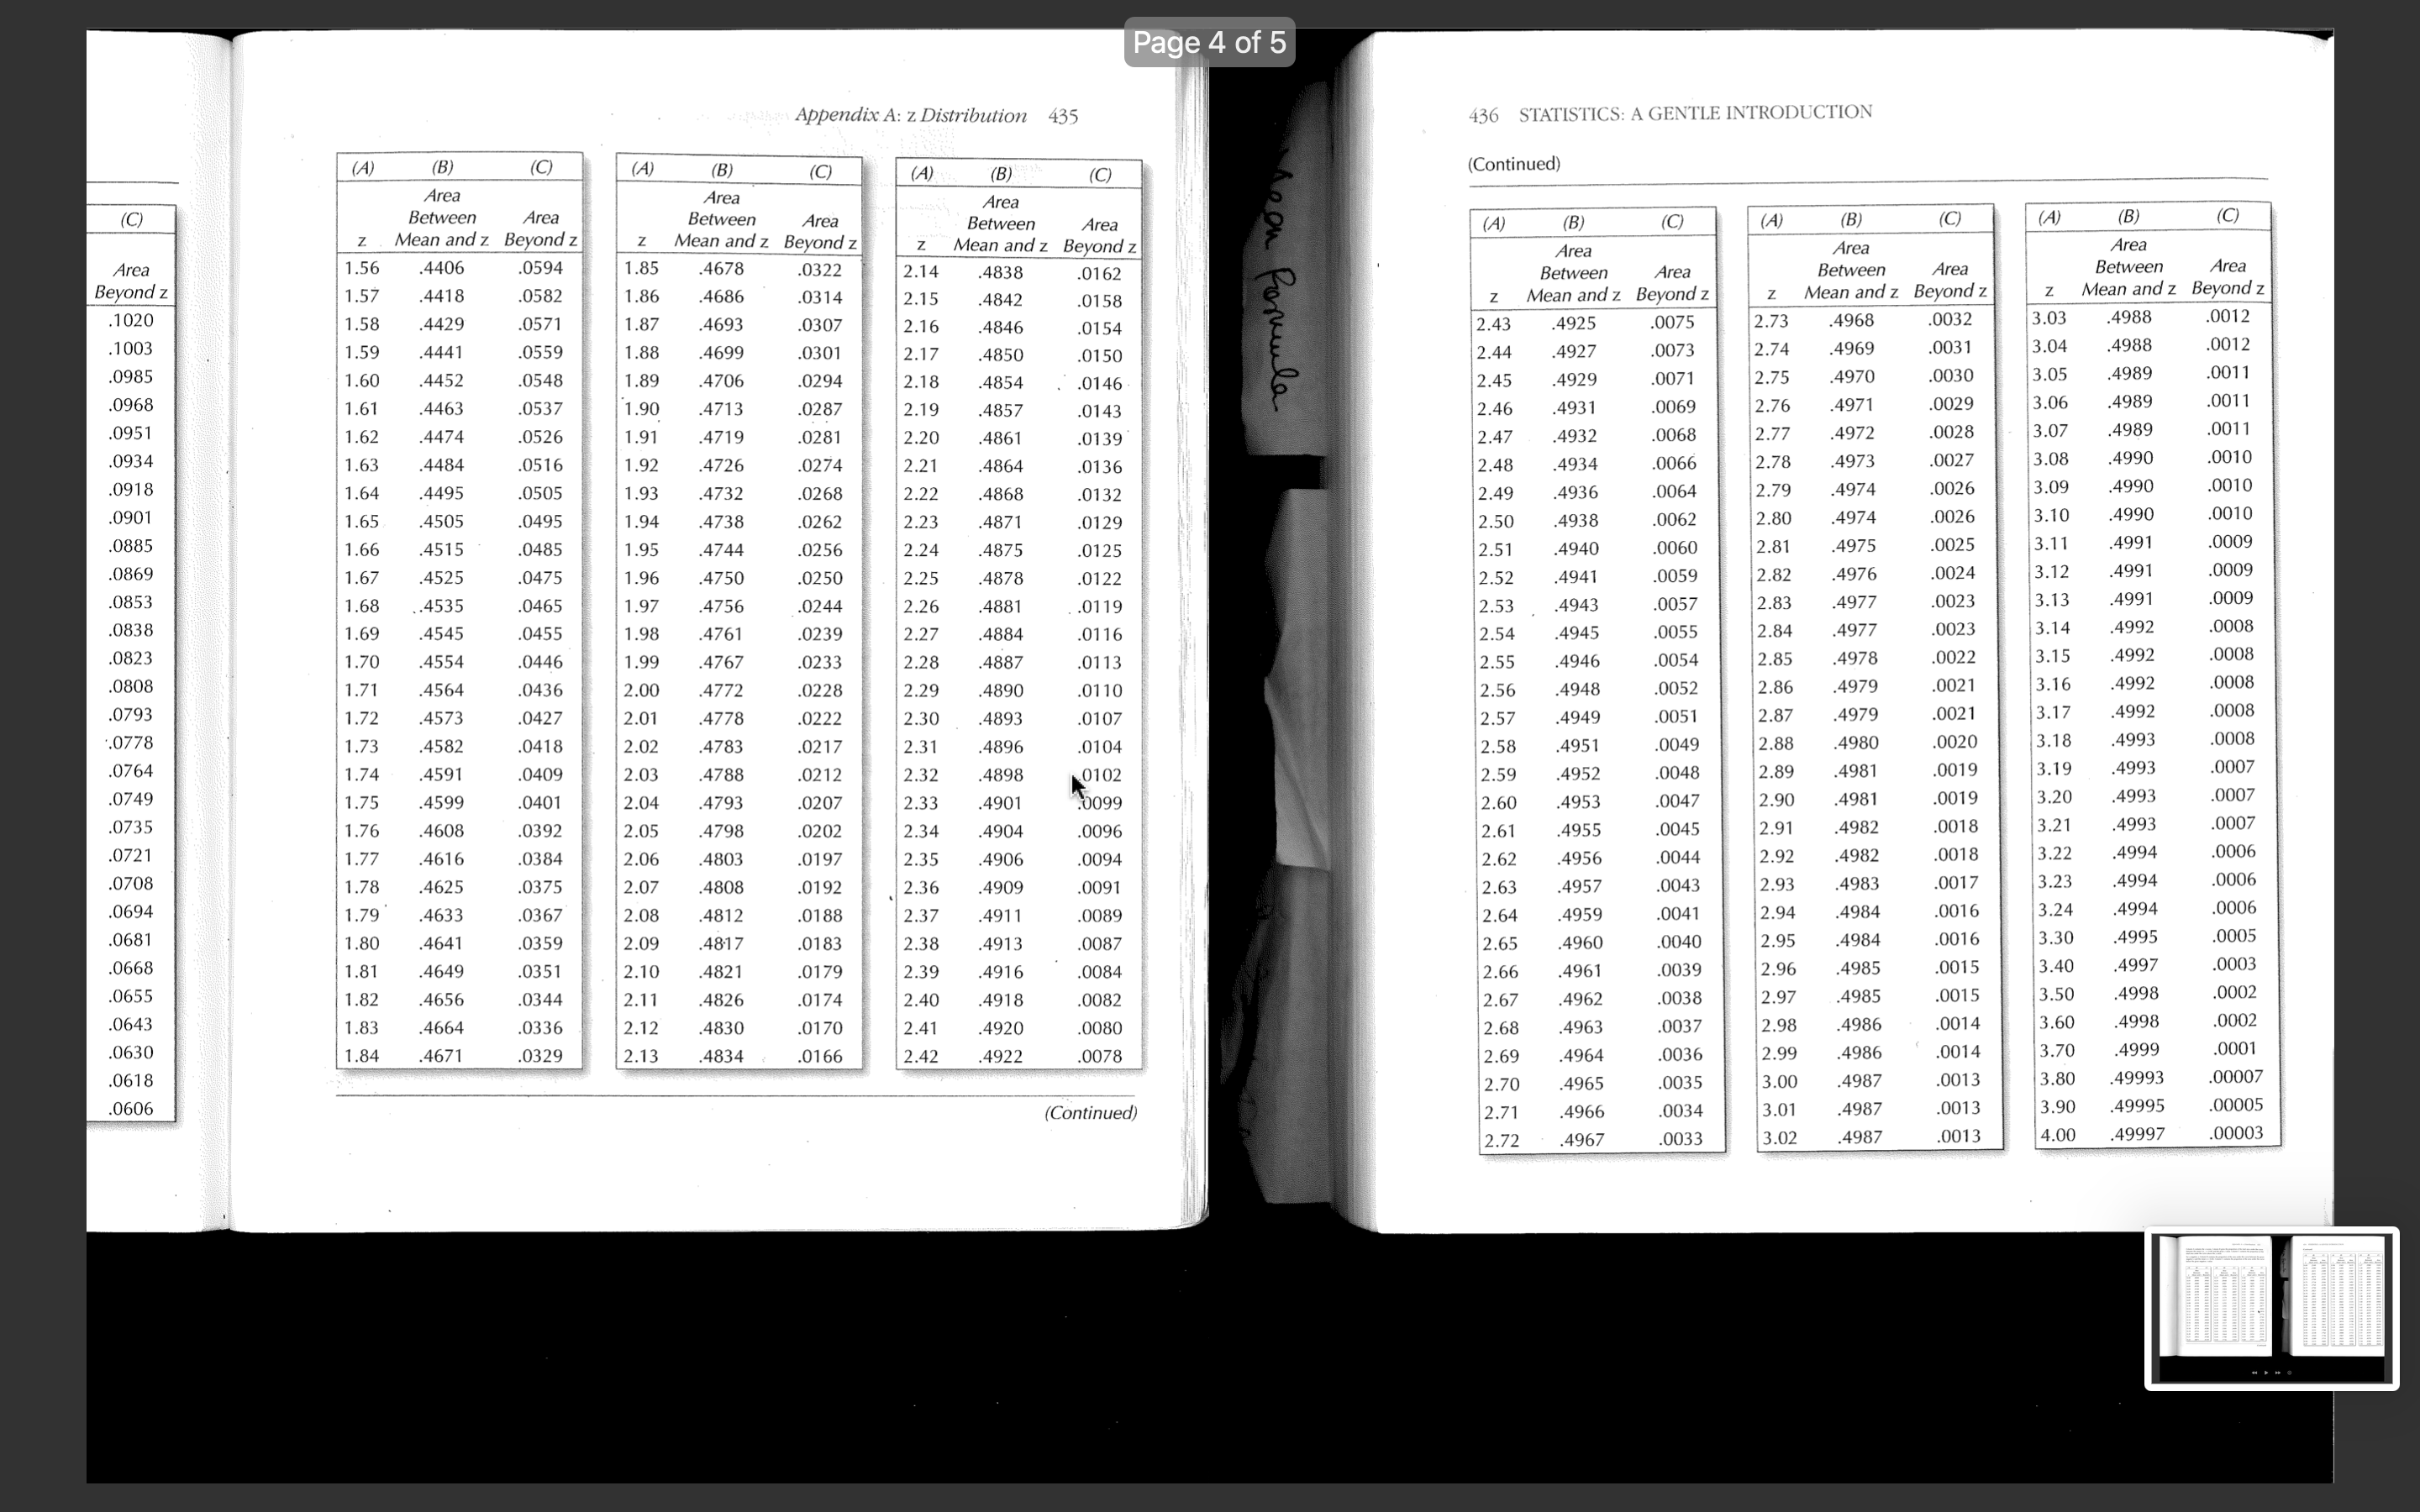
125% View Zoom Add Page Insert Table Chart Text Shape Media Comment Collaborate Format Document Add breaks, page numbers, links, and more. In this assignment, using the ricanuly LIC Expectancy (MALE) at birth data from a sample of 150 countries, you will learn to import excel data file into SPSS, become familiar with SPSS environment, define variable properties, calculate basic descriptive statistics, convert raw scores into z scores in SPSS, and practice using the z-distribution table and find percentile ranking. This assignment is divided into two parts. In the first part, you will learn some basic functions of SPSS and run descriptive tests and standardize raw scores. In the second part, you will calculate proportion of scores using the z-distribution table (Appendix A, page 432 of your textbook/Also posted in M2 Assignment page), and find percentile ranking. Part 1 - SPSS Practice 1. Import the excel file 'WHO HALE at birth 2016 male female sample 150.xlsx' into SPSS 2. Define variable properties. 3. Calculate measures of central tendency, measures of variation, skewness, kurtosis, and confidence interval of the means for each sex. Copy and paste all relevant tables and graphs. 4. Standardize the HALE scores for each country. In other words, convert raw scores into z scores. Nothing selected. Descriptiv Select an object or text to format. es Statistic Std. Error Male Mean 61.671 0.5873 HALE 95% Lower 60.511 Confidence Bound Interval for Mean Upper 62.832 Bound125% EB Collaborate Format Document Comment View Zoom Add Page Insert Table Chart Text Shape Media Statistics Name Descriptiv es 5% 61.871 Trimmed Mean Median 62.950 Variance 51.735 Std. 7.1927 Deviation Minimum 43.9 Nothing selected. Select an object or text to format. Maximum 78.8 Range 34.9 Interquarti 10.2 le Range Skewness -0.355 0.198 Kurtosis -0.514 0.394 Female Mean 65.077 0.6002 HALEView 1 25% v Zoom Add Page r
Step by Step Solution
There are 3 Steps involved in it

Get step-by-step solutions from verified subject matter experts