

Question: PLEASE ANSWER THE 5 QUESTIONS BELOW ASAP!!!!!! I ONLY HAVE AN HOUR I PROVIDED YOU WITH ALL THE GIVEN PLEASE FAST!!! Document1 Q Search in
PLEASE ANSWER THE 5 QUESTIONS BELOW ASAP!!!!!! I ONLY HAVE AN HOUR I PROVIDED YOU WITH ALL THE GIVEN PLEASE FAST!!!
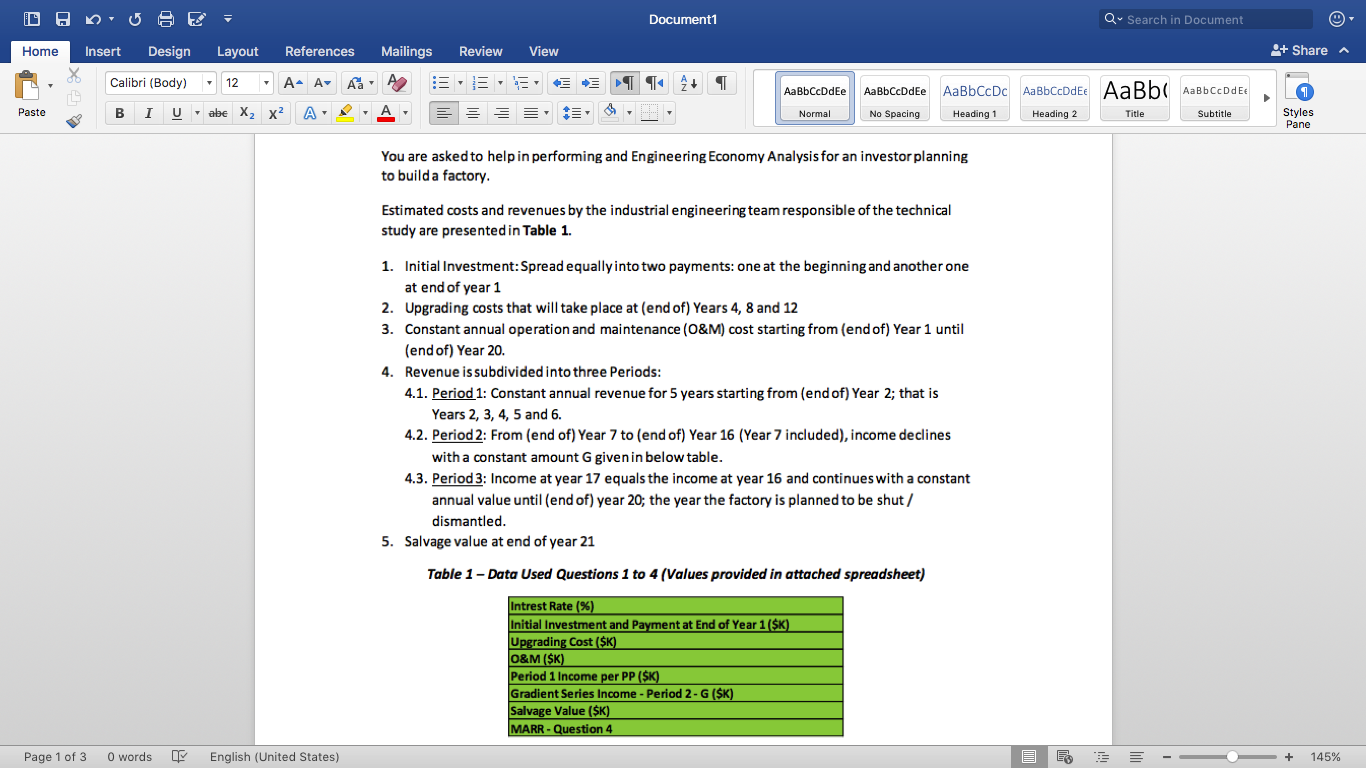
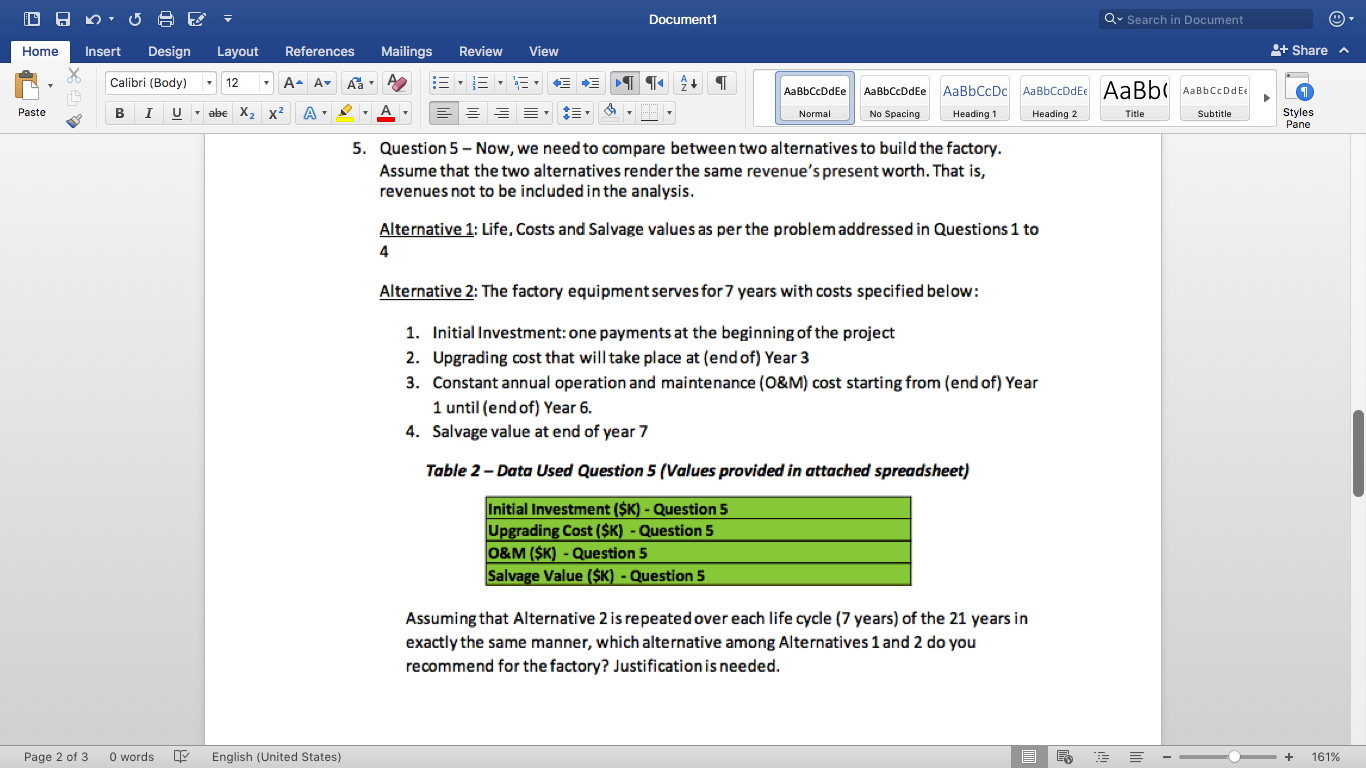
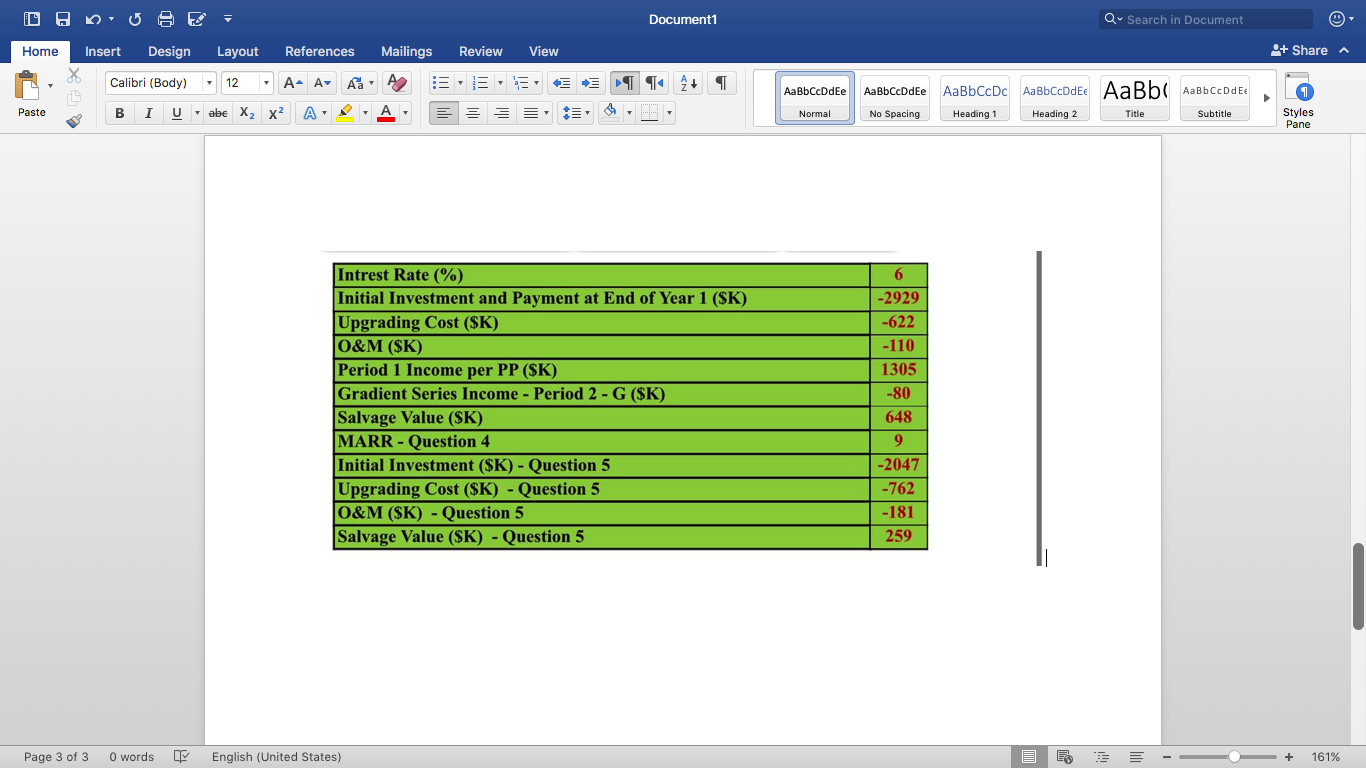
Document1 Q Search in Document Home Insert Design Layout References Mailings Review View + Share Calibri (Body) 12 A- A- Aa E TT A AaBbCcDdEe AaBbCcDdEe AabbCcDc AaBbCcDdEe AaBb Aabb CcDdEx Paste B Uabe Xx2 A Normal No Spacing Heading 1 Heading 2 Title Subtitle Styles Pane You are asked to help in performing and Engineering Economy Analysis for an investor planning to build a factory Estimated costs and revenues by the industrial engineering team responsible of the technical study are presented in Table 1. 1. Initial Investment: Spread equally into two payments: one at the beginning and another one at end of year 1 2. Upgrading costs that will take place at (end of) Years 4, 8 and 12 3. Constant annual operation and maintenance (O&M) cost starting from (end of) Year 1 until (end of) Year 20. 4. Revenue is subdivided into three Periods: 4.1. Period 1: Constant annual revenue for 5 years starting from (end of) Year 2; that is Years 2, 3, 4, 5 and 6. 4.2. Period 2: From (end of) Year 7 to (end of) Year 16 (Year 7 included), income declines with a constant amount G given in below table. 4.3. Period 3: Income at year 17 equals the income at year 16 and continues with a constant annual value until (end of) year 20; the year the factory is planned to be shut/ dismantled. 5. Salvage value at end of year 21 Table 1 - Data Used Questions 1 to 4 (Values provided in attached spreadsheet) Intrest Rate (%) Initial Investment and Payment at End of Year 1(SK) Upgrading Cost (SK) O&M ($K) Period 1 Income per PP (SK) Gradient Series Income - Period 2-G ($K) Salvage Value (SK) MARR - Question 4 Page 1 of 3 O words English (United States) + 145% Document1 Q Search in Document Home Insert Design Layout References Mailings Review View + Share Calibri (Body) 12 A- A- Aa A EE T AT AaBbCcDdEe AaBbCcDdEe AaBbCcDc AaBbCcDdEe AaBb AaBb CcDdEt Paste B Uabe Xx2 A Normal No Spacing Heading 1 Heading 2 Title Subtitle Styles Pane Note: $K denotes thousands USD Please read carefully: It is strongly recommended for your understanding to plot the Cash Flow Diagram illustrating all the costs and revenues. It is strongly recommended that you write your equations / answers clearly to help me reading your analysis. Intermediate answers would help me analyzing where you did a mistake. In case you have doubt about one answer (or sub-answer), assume a value and use it to continue your calculation / analysis. Page 1 of 3 O words English (United States) + 145% Document1 Q Search in Document Home Insert Design Layout References Mailings Review View + Share Calibri (Body) 12 A- A- A. A TT A+ AaBbCcDdEe AaBbCcDdEe AaBbCcDc AaBbCcDdEt AaBb AalbCcDdEx Paste B Uabe Xx2 Normal No Spacing Heading 1 Heading 2 Title Subtitle Styles Pane 1. Question 1 - Determine the Present Worth Note: It is recommended to include in your answer sheet the intermediate answers for 1, 2, 3, 4.1, 4.2, 4.3 and 5 2. Question 2-Determine the project Payback Period. Justification is needed. 3. Question 3 - Determine the project Rate of Return. Justification is needed. 4. Question 4 - With the MARR specified in the table, do you recommend to invest in this project? Justification is needed. English (United States) Page 2 of 3 O words 218% Document1 Q Search in Document Home Insert Design Layout References Mailings Review View + Share Calibri (Body) 12 A- A- A. A 4+ AaBbCcDdEe AaBbCcDdEe AaBbCcDc AaBbccddee AaBbc Aabb Cedd Ee Paste B Uabe Xx2 A Normal No Spacing Heading 1 Heading 2 Title Subtitle Styles Pane 5. Question 5 - Now, we need to compare between two alternatives to build the factory. Assume that the two alternatives render the same revenue's present worth. That is, revenues not to be included in the analysis. Alternative 1: Life, Costs and Salvage values as per the problem addressed in Questions 1 to 4 Alternative 2: The factory equipment serves for 7 years with costs specified below: 1. Initial Investment: one payments at the beginning of the project 2. Upgrading cost that will take place at (end of) Year 3 3. Constant annual operation and maintenance (O&M) cost starting from (end of) Year 1 until (end of) Year 6. 4. Salvage value at end of year 7 Table 2 - Data Used Question 5 (Values provided in attached spreadsheet) Initial Investment ($K) - Question 5 Upgrading Cost (SK) - Question 5 O&M ($K) - Question 5 Salvage Value (SK) - Question 5 Assuming that Alternative 2 is repeated over each life cycle ( 7 years) of the 21 years in exactly the same manner, which alternative among Alternatives 1 and 2 do you recommend for the factory? Justification is needed. Page 2 of 3 O words English (United States) + 161% Document1 Q Search in Document Home Insert Design Layout References Mailings Review View + Share Calibri (Body) 12 A- A- A. TT AT AaBbCcDdEe AaBbCcDdEe AaBbCcDc AaBbCcDdEe AaBbc AabbCcDdEx Paste B Uabe X2 x2 Normal No Spacing Heading 1 Heading 2 Title Subtitle Styles Pane 6 -2929 -622 -110 1305 -80 Intrest Rate (%) Initial Investment and Payment at End of Year 1 (SK) Upgrading Cost ($K) O&M (SK) Period 1 Income per PP (SK) Gradient Series Income - Period 2 - G (SK) Salvage Value (SK) MARR - Question 4 Initial Investment ($K) - Question 5 Upgrading Cost (SK) - Question 5 O&M (SK) - Question 5 Salvage Value (SK) - Question 5 648 9 -2047 -762 -181 259 Page 3 of 3 O words English (United States) 161% Document1 Q Search in Document Home Insert Design Layout References Mailings Review View + Share Calibri (Body) 12 A- A- Aa E TT A AaBbCcDdEe AaBbCcDdEe AabbCcDc AaBbCcDdEe AaBb Aabb CcDdEx Paste B Uabe Xx2 A Normal No Spacing Heading 1 Heading 2 Title Subtitle Styles Pane You are asked to help in performing and Engineering Economy Analysis for an investor planning to build a factory Estimated costs and revenues by the industrial engineering team responsible of the technical study are presented in Table 1. 1. Initial Investment: Spread equally into two payments: one at the beginning and another one at end of year 1 2. Upgrading costs that will take place at (end of) Years 4, 8 and 12 3. Constant annual operation and maintenance (O&M) cost starting from (end of) Year 1 until (end of) Year 20. 4. Revenue is subdivided into three Periods: 4.1. Period 1: Constant annual revenue for 5 years starting from (end of) Year 2; that is Years 2, 3, 4, 5 and 6. 4.2. Period 2: From (end of) Year 7 to (end of) Year 16 (Year 7 included), income declines with a constant amount G given in below table. 4.3. Period 3: Income at year 17 equals the income at year 16 and continues with a constant annual value until (end of) year 20; the year the factory is planned to be shut/ dismantled. 5. Salvage value at end of year 21 Table 1 - Data Used Questions 1 to 4 (Values provided in attached spreadsheet) Intrest Rate (%) Initial Investment and Payment at End of Year 1(SK) Upgrading Cost (SK) O&M ($K) Period 1 Income per PP (SK) Gradient Series Income - Period 2-G ($K) Salvage Value (SK) MARR - Question 4 Page 1 of 3 O words English (United States) + 145% Document1 Q Search in Document Home Insert Design Layout References Mailings Review View + Share Calibri (Body) 12 A- A- Aa A EE T AT AaBbCcDdEe AaBbCcDdEe AaBbCcDc AaBbCcDdEe AaBb AaBb CcDdEt Paste B Uabe Xx2 A Normal No Spacing Heading 1 Heading 2 Title Subtitle Styles Pane Note: $K denotes thousands USD Please read carefully: It is strongly recommended for your understanding to plot the Cash Flow Diagram illustrating all the costs and revenues. It is strongly recommended that you write your equations / answers clearly to help me reading your analysis. Intermediate answers would help me analyzing where you did a mistake. In case you have doubt about one answer (or sub-answer), assume a value and use it to continue your calculation / analysis. Page 1 of 3 O words English (United States) + 145% Document1 Q Search in Document Home Insert Design Layout References Mailings Review View + Share Calibri (Body) 12 A- A- A. A TT A+ AaBbCcDdEe AaBbCcDdEe AaBbCcDc AaBbCcDdEt AaBb AalbCcDdEx Paste B Uabe Xx2 Normal No Spacing Heading 1 Heading 2 Title Subtitle Styles Pane 1. Question 1 - Determine the Present Worth Note: It is recommended to include in your answer sheet the intermediate answers for 1, 2, 3, 4.1, 4.2, 4.3 and 5 2. Question 2-Determine the project Payback Period. Justification is needed. 3. Question 3 - Determine the project Rate of Return. Justification is needed. 4. Question 4 - With the MARR specified in the table, do you recommend to invest in this project? Justification is needed. English (United States) Page 2 of 3 O words 218% Document1 Q Search in Document Home Insert Design Layout References Mailings Review View + Share Calibri (Body) 12 A- A- A. A 4+ AaBbCcDdEe AaBbCcDdEe AaBbCcDc AaBbccddee AaBbc Aabb Cedd Ee Paste B Uabe Xx2 A Normal No Spacing Heading 1 Heading 2 Title Subtitle Styles Pane 5. Question 5 - Now, we need to compare between two alternatives to build the factory. Assume that the two alternatives render the same revenue's present worth. That is, revenues not to be included in the analysis. Alternative 1: Life, Costs and Salvage values as per the problem addressed in Questions 1 to 4 Alternative 2: The factory equipment serves for 7 years with costs specified below: 1. Initial Investment: one payments at the beginning of the project 2. Upgrading cost that will take place at (end of) Year 3 3. Constant annual operation and maintenance (O&M) cost starting from (end of) Year 1 until (end of) Year 6. 4. Salvage value at end of year 7 Table 2 - Data Used Question 5 (Values provided in attached spreadsheet) Initial Investment ($K) - Question 5 Upgrading Cost (SK) - Question 5 O&M ($K) - Question 5 Salvage Value (SK) - Question 5 Assuming that Alternative 2 is repeated over each life cycle ( 7 years) of the 21 years in exactly the same manner, which alternative among Alternatives 1 and 2 do you recommend for the factory? Justification is needed. Page 2 of 3 O words English (United States) + 161% Document1 Q Search in Document Home Insert Design Layout References Mailings Review View + Share Calibri (Body) 12 A- A- A. TT AT AaBbCcDdEe AaBbCcDdEe AaBbCcDc AaBbCcDdEe AaBbc AabbCcDdEx Paste B Uabe X2 x2 Normal No Spacing Heading 1 Heading 2 Title Subtitle Styles Pane 6 -2929 -622 -110 1305 -80 Intrest Rate (%) Initial Investment and Payment at End of Year 1 (SK) Upgrading Cost ($K) O&M (SK) Period 1 Income per PP (SK) Gradient Series Income - Period 2 - G (SK) Salvage Value (SK) MARR - Question 4 Initial Investment ($K) - Question 5 Upgrading Cost (SK) - Question 5 O&M (SK) - Question 5 Salvage Value (SK) - Question 5 648 9 -2047 -762 -181 259 Page 3 of 3 O words English (United States) 161%
Step by Step Solution
There are 3 Steps involved in it

Get step-by-step solutions from verified subject matter experts