

Question: Please answer the a b and c please Problem # 3 (12.5 pts) The following table shows the percentage of the vote predicted by a
Please answer the a b and c please
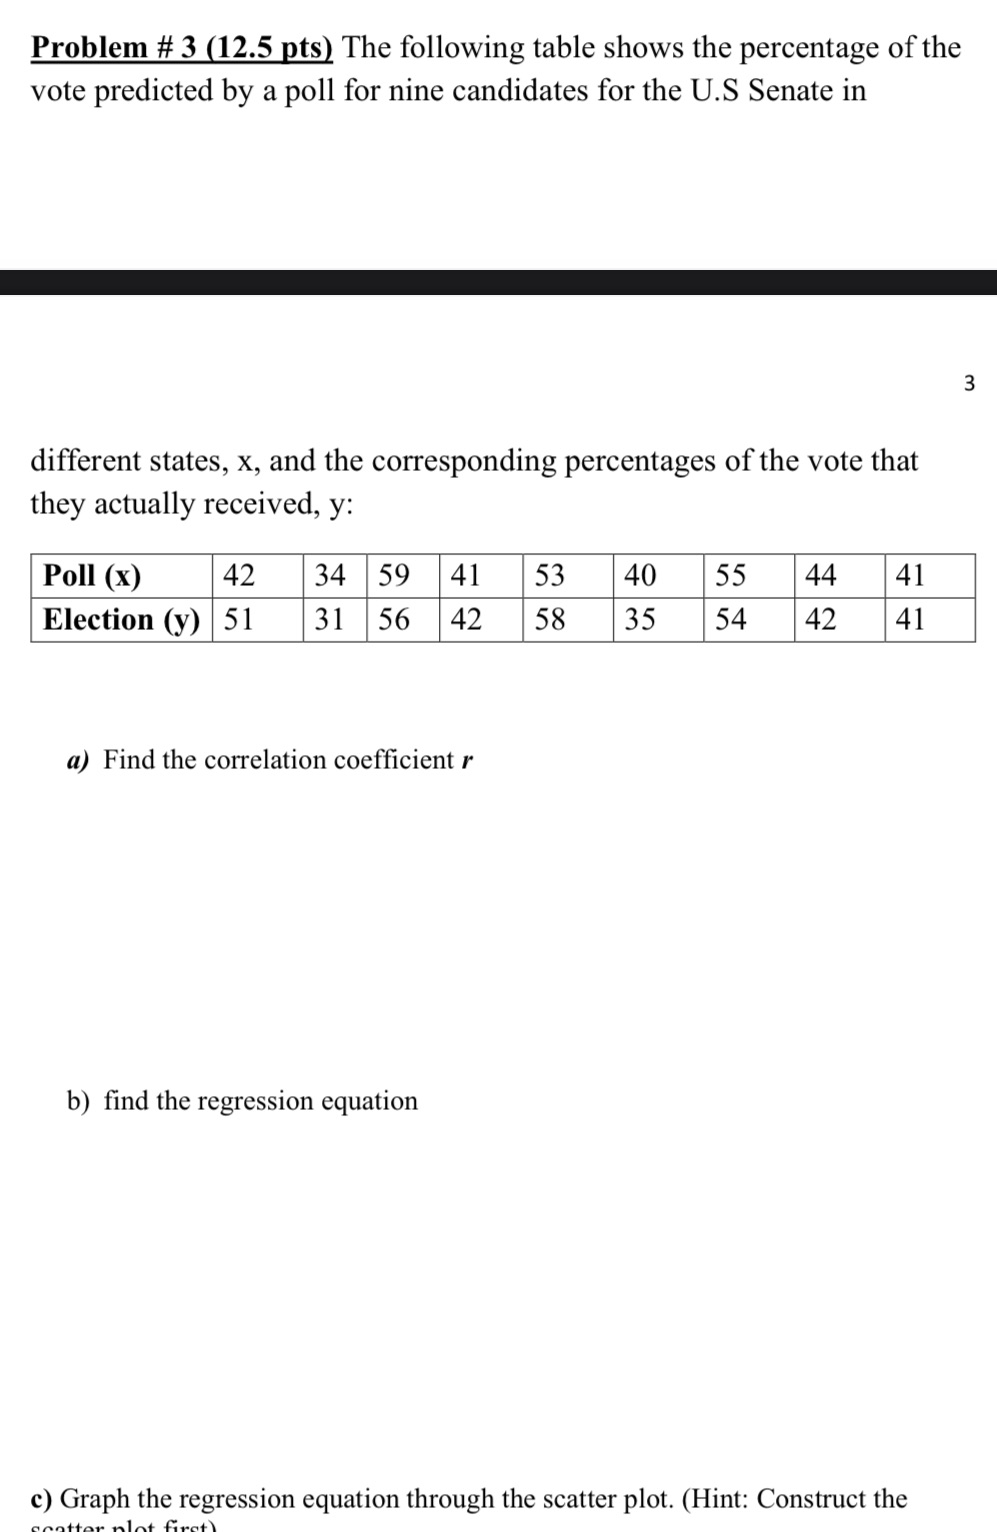
Problem # 3 (12.5 pts) The following table shows the percentage of the vote predicted by a poll for nine candidates for the U.S Senate in 3 different states, x, and the corresponding percentages of the vote that they actually received, y: Poll (x) 42 34 59 41 53 40 55 44 41 Election (y) 51 31 56 42 58 35 54 42 41 a) Find the correlation coefficient r b) find the regression equation c) Graph the regression equation through the scatter plot. (Hint: Construct the
Step by Step Solution
There are 3 Steps involved in it
1 Expert Approved Answer
Step: 1 Unlock

Question Has Been Solved by an Expert!
Get step-by-step solutions from verified subject matter experts
Step: 2 Unlock
Step: 3 Unlock