

Question: Please answer the attached Factual Questions with the attached information. 5.7 t-Test for Dependent Groups with Effect Size I Increasing Technology Use STATISTICAL GUIDE In
Please answer the attached "Factual Questions" with the attached information.
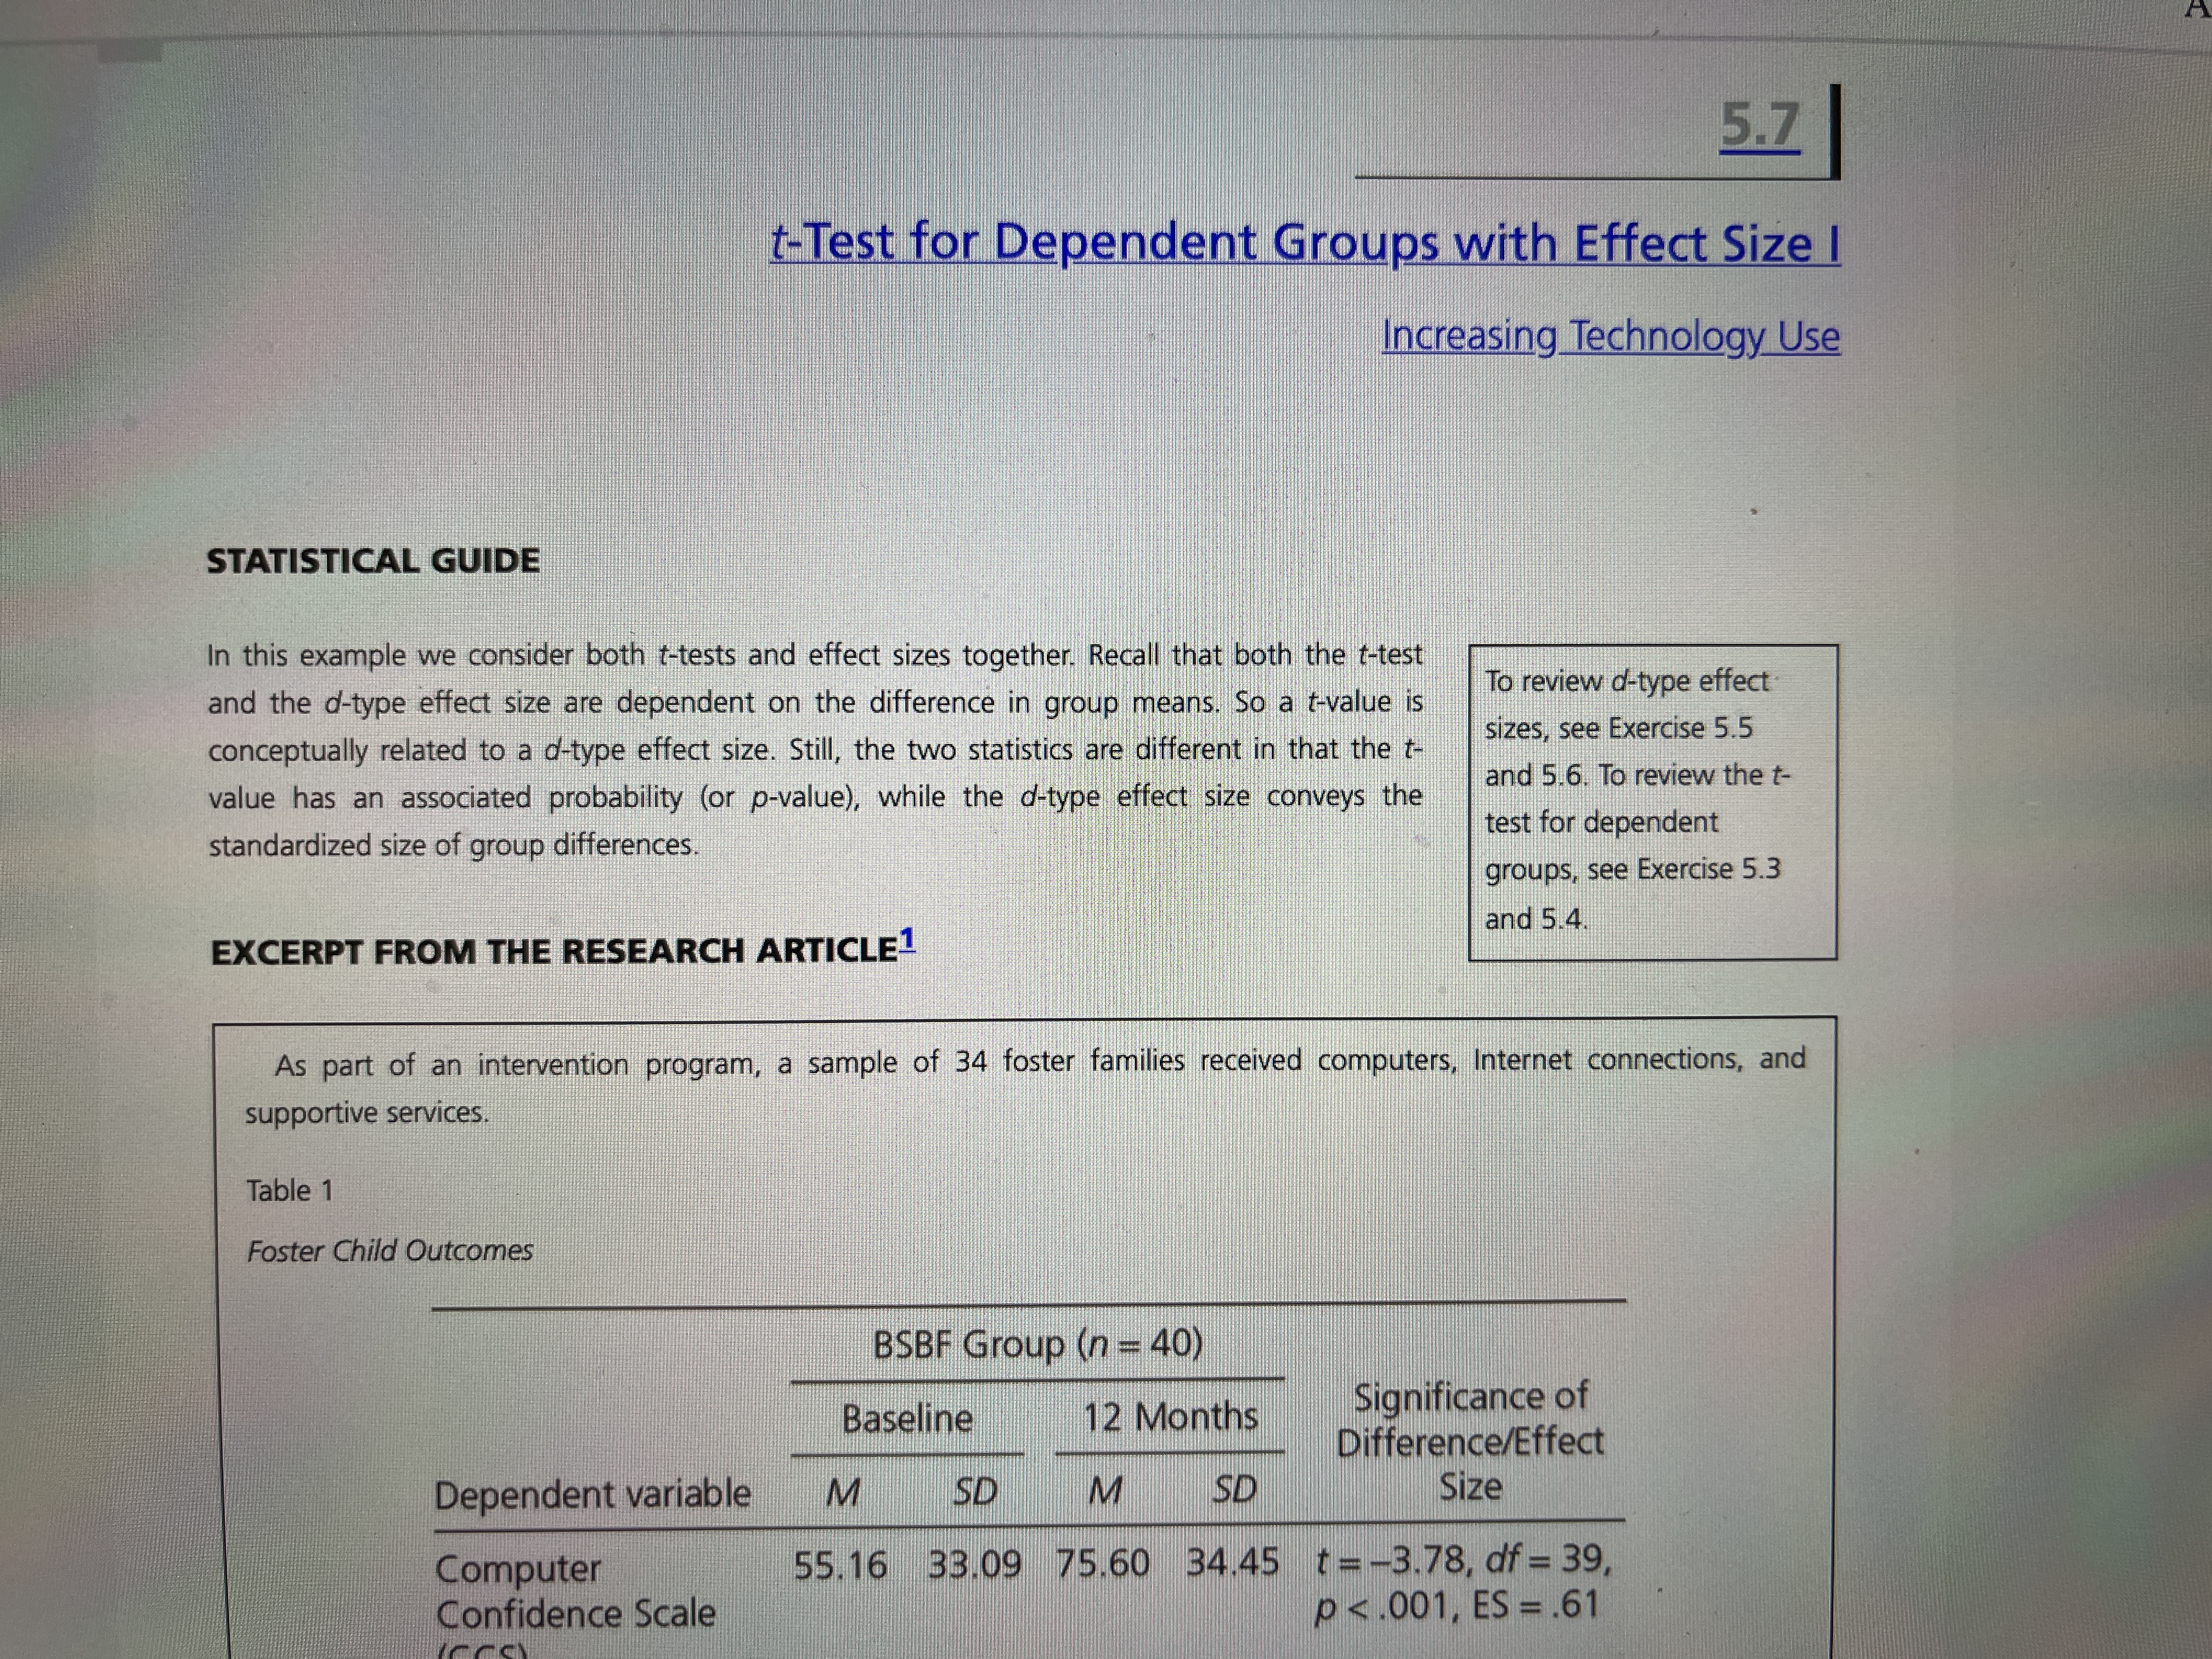
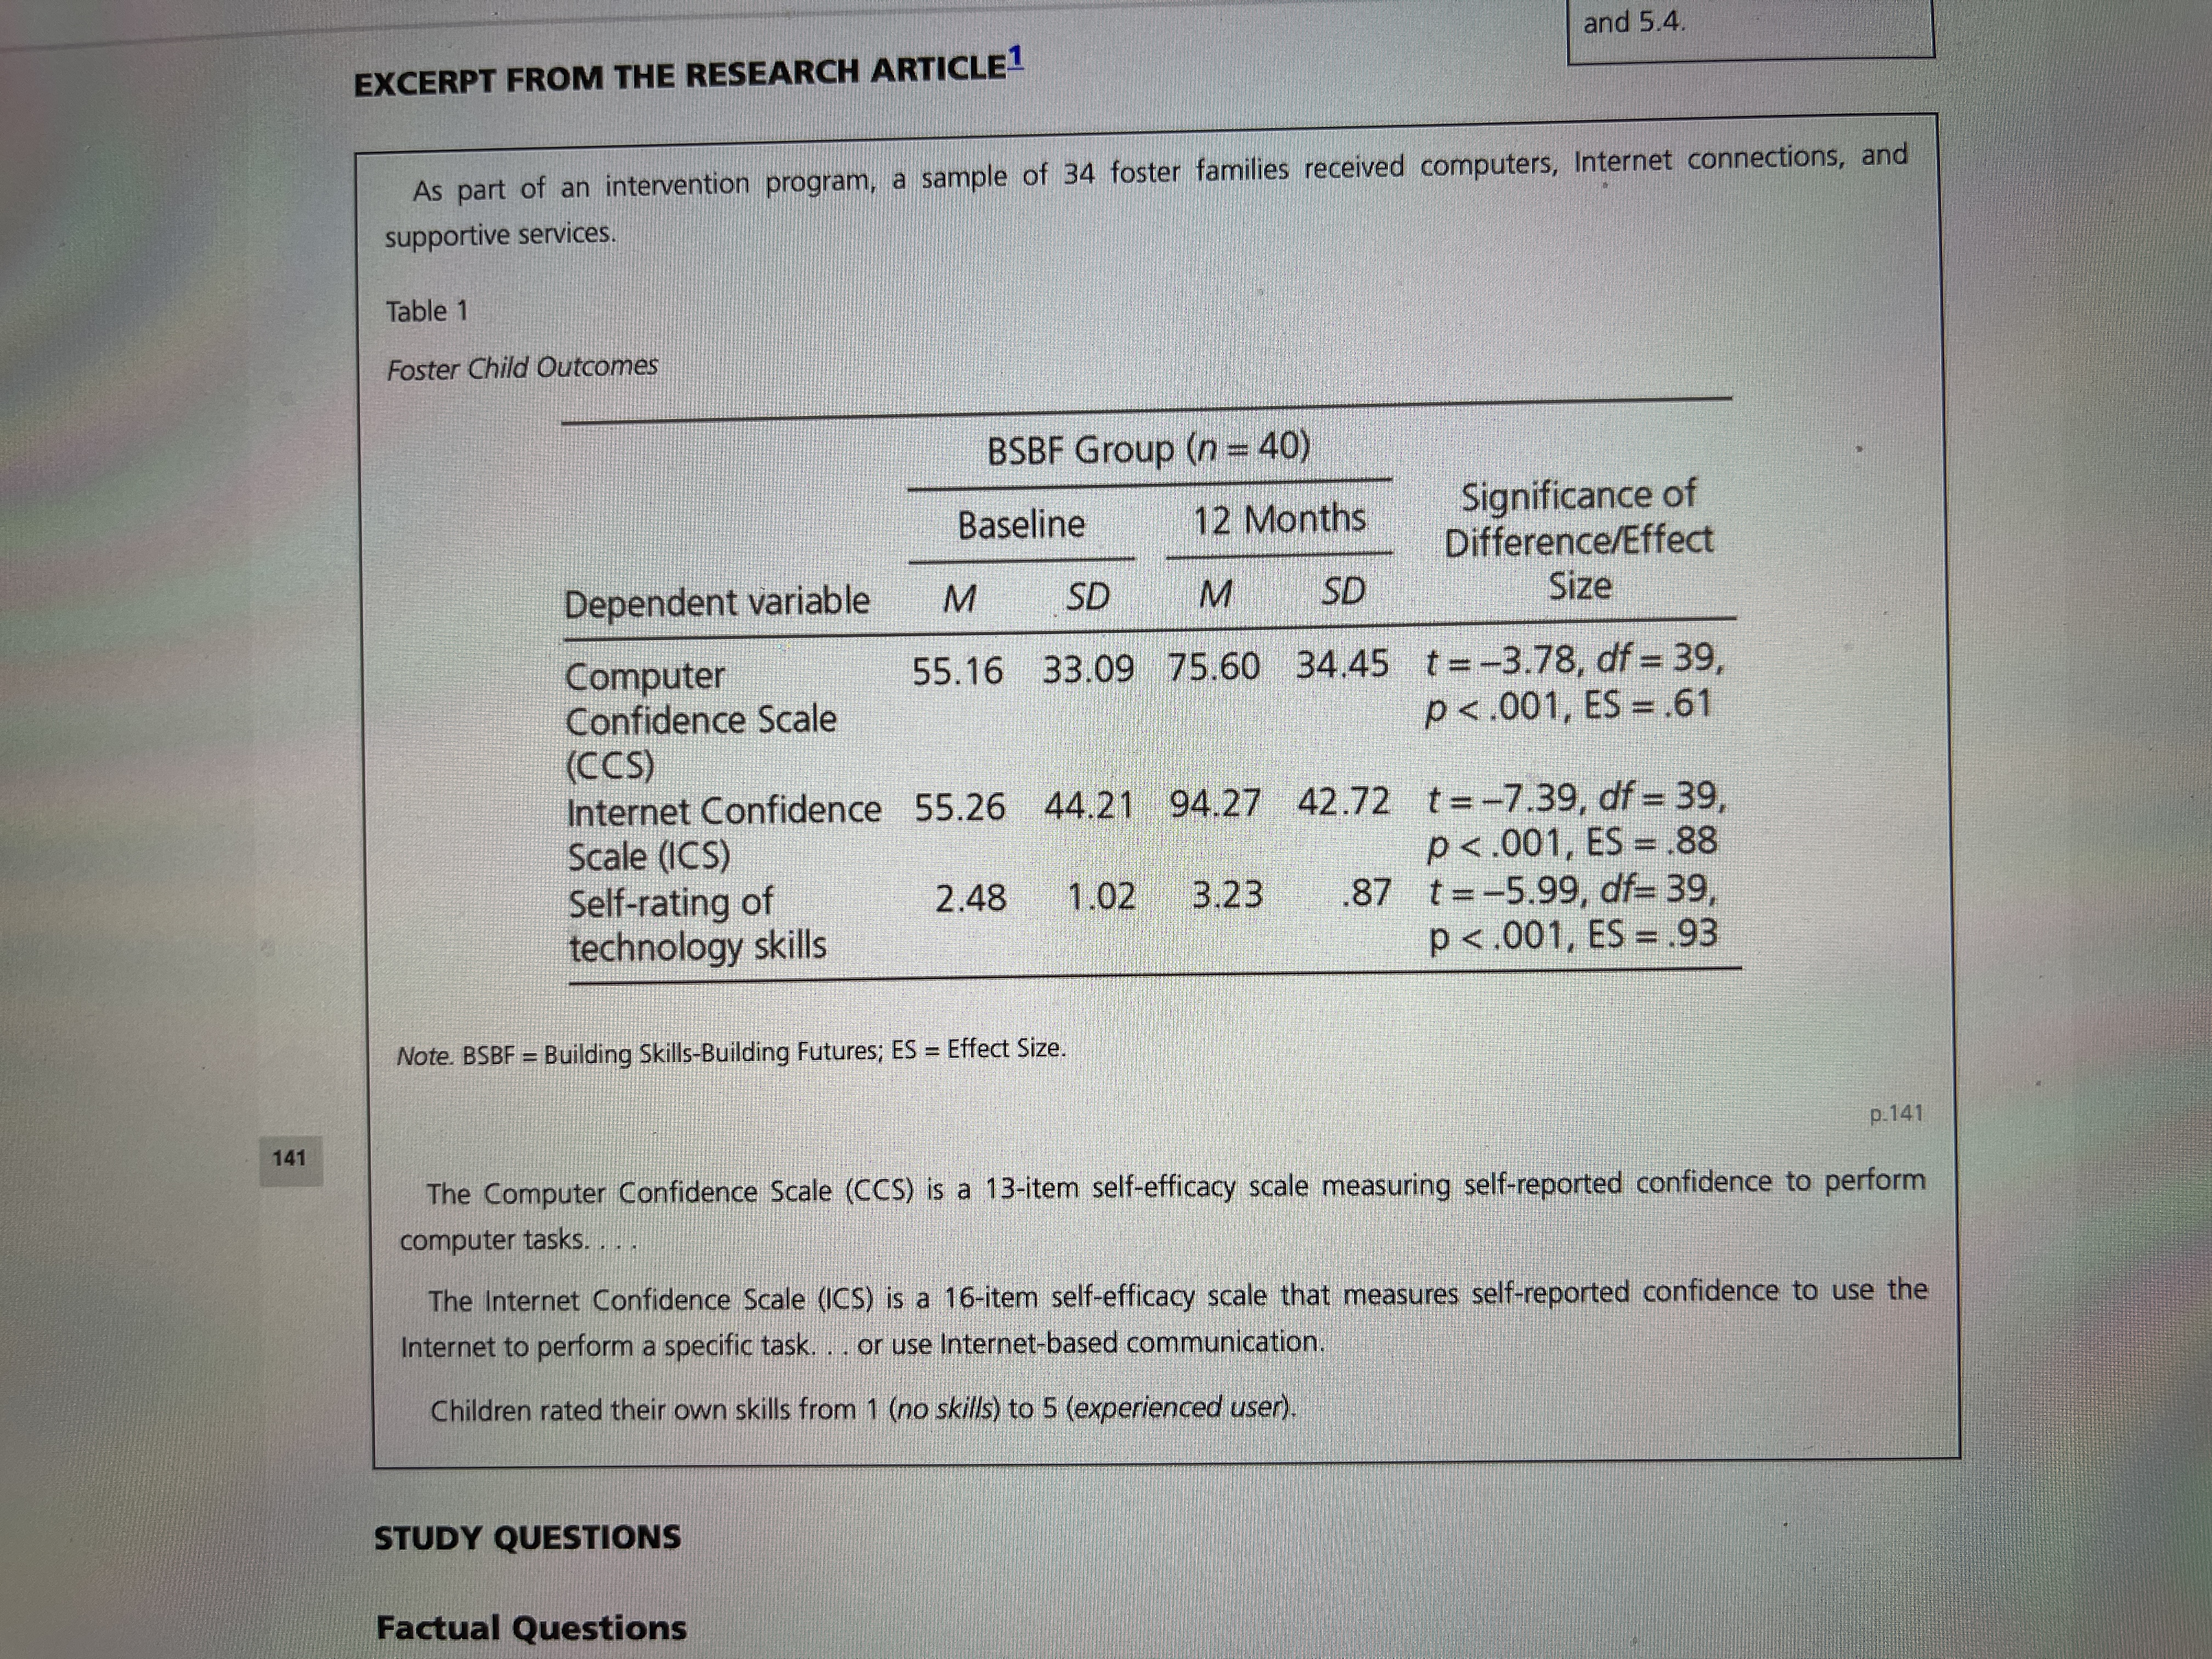
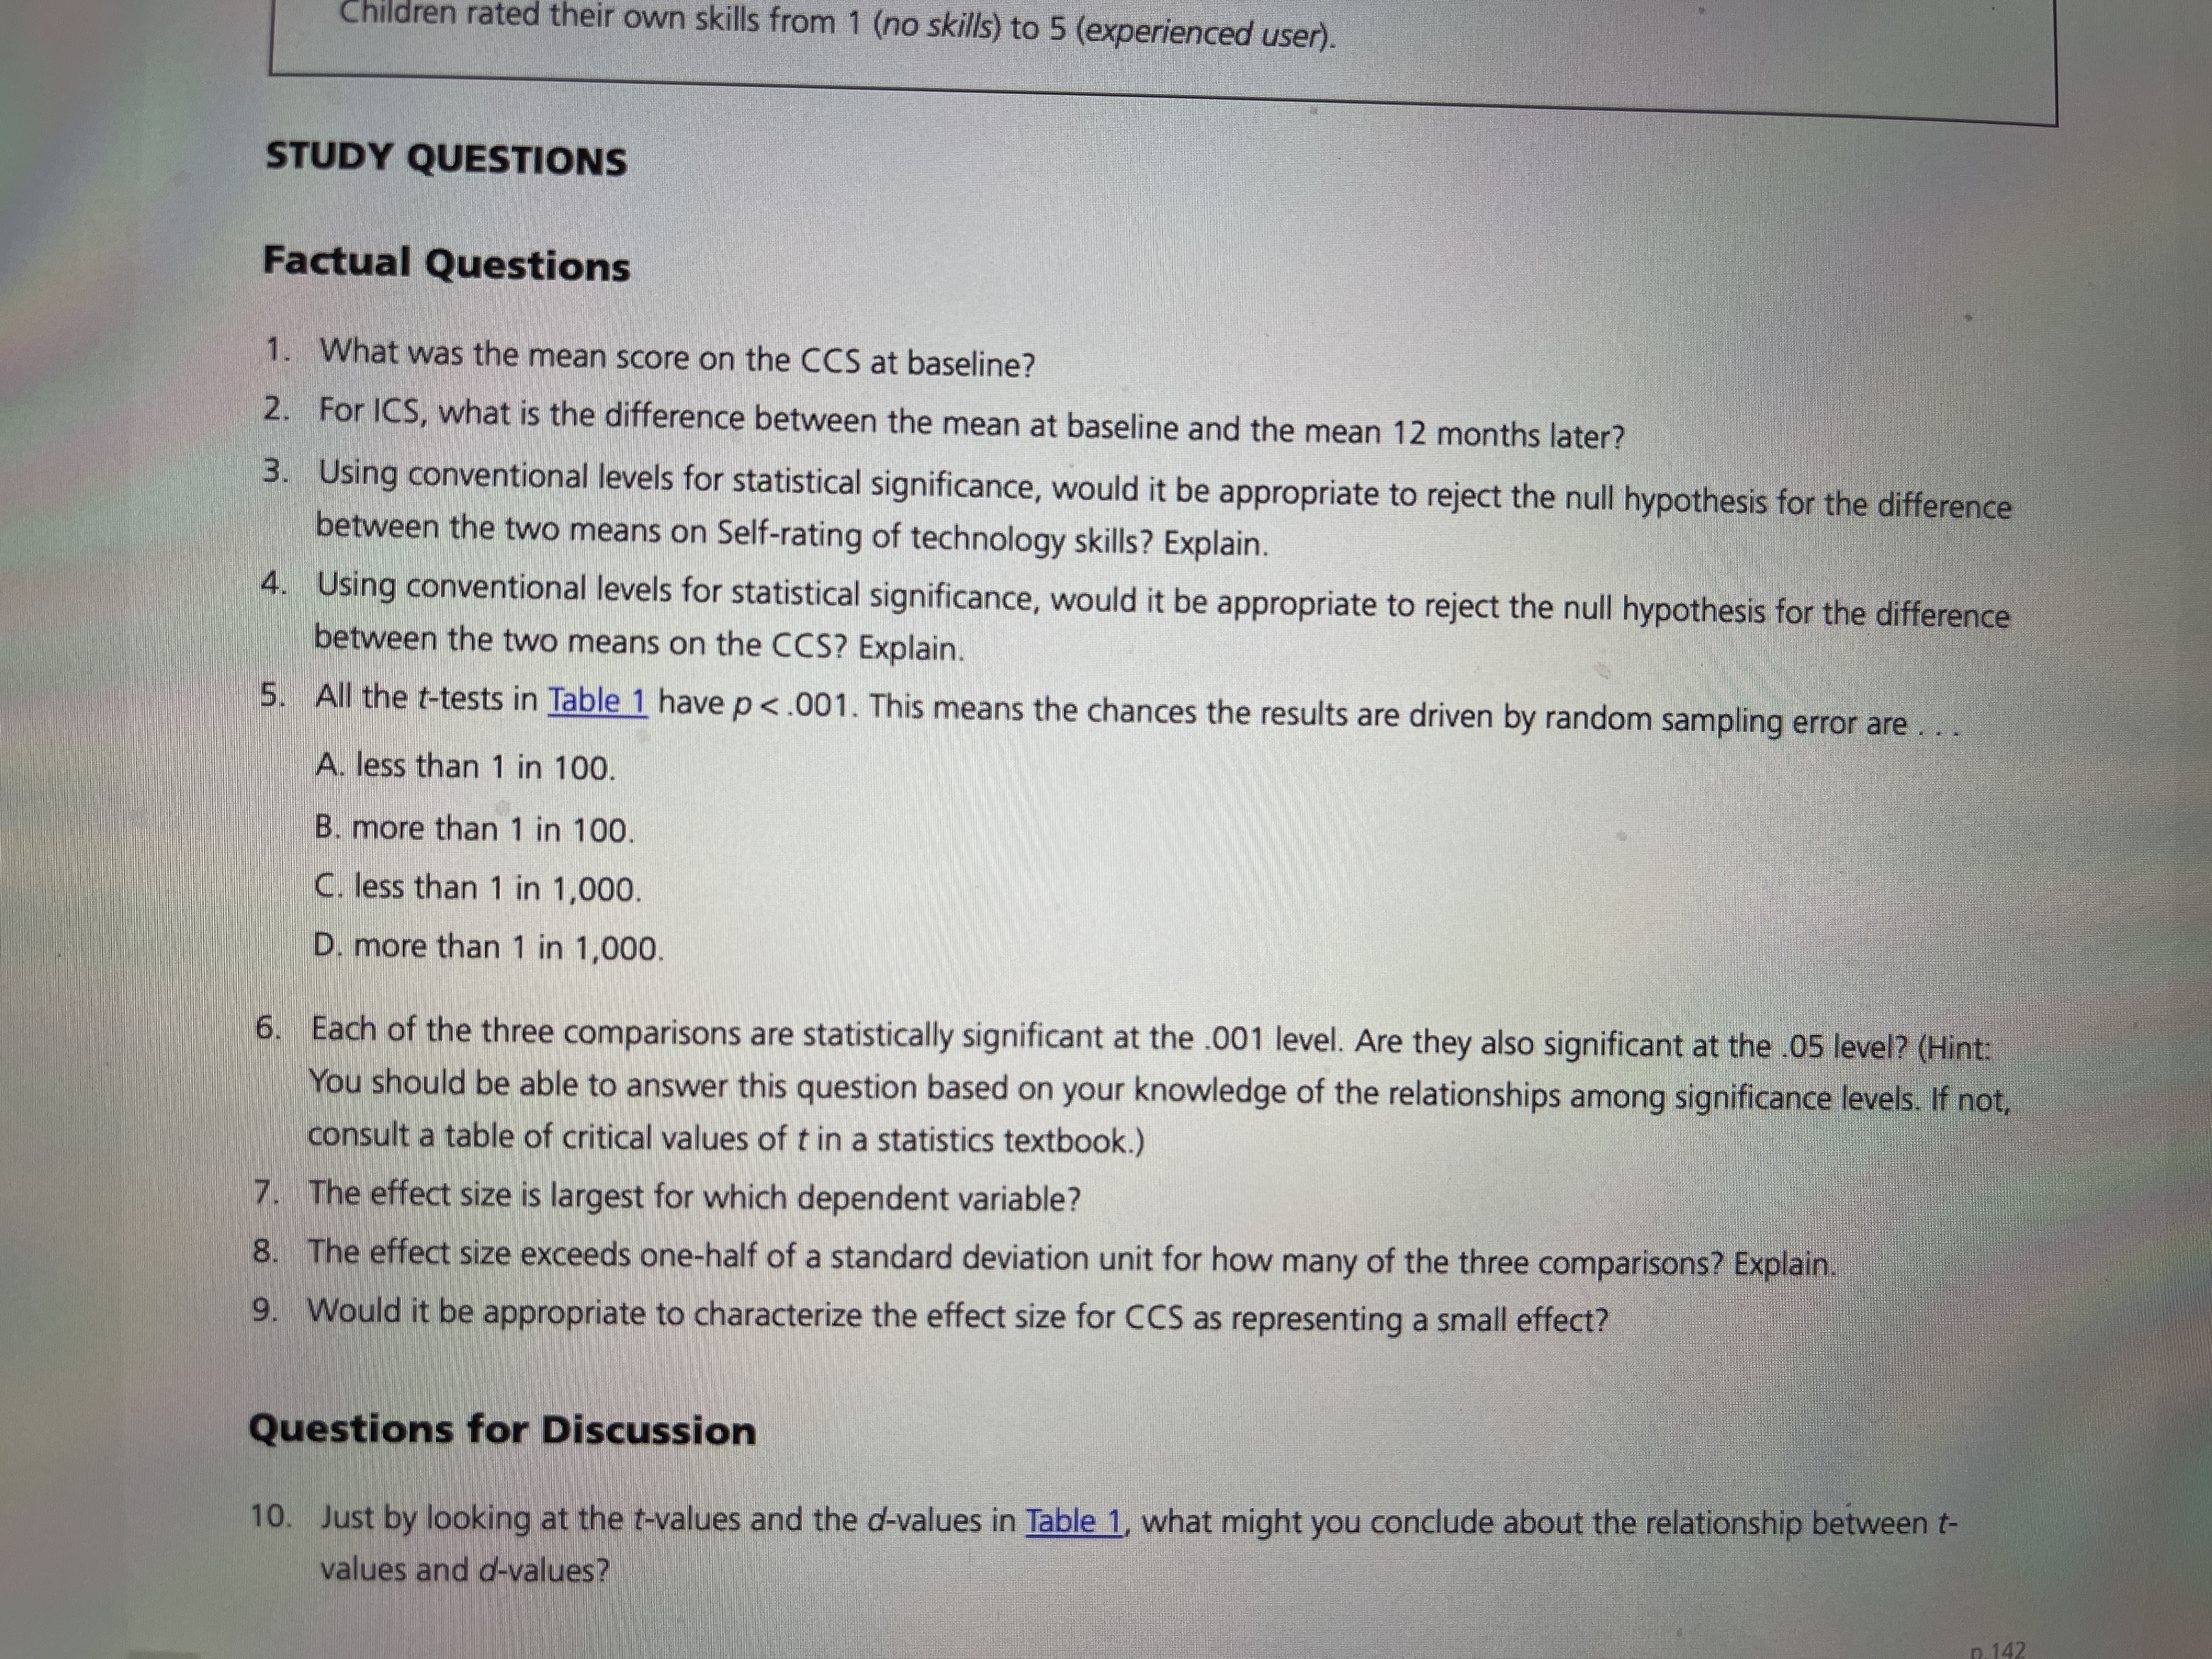
5.7 t-Test for Dependent Groups with Effect Size I Increasing Technology Use STATISTICAL GUIDE In this example we consider both t-tests and effect sizes together. Recall that both the t-test and the d-type effect size are dependent on the difference in group means. So a t-value is To review d-type effect conceptually related to a d-type effect size. Still, the two statistics are different in that the t- sizes, see Exercise 5.5 value has an associated probability (or p-value), while the d-type effect size conveys the and 5.6. To review the t- standardized size of group differences. test for dependent groups, see Exercise 5.3 and 5.4. EXCERPT FROM THE RESEARCH ARTICLE1 As part of an intervention program, a sample of 34 foster families received computers, Internet connections, and supportive services. Table 1 Foster Child Outcomes BSBF Group (n = 40) Baseline 12 Months Significance of Difference/Effect Dependent variable M SD M SD Size Computer 55.16 33.09 75.60 34.45 t=-3.78, df = 39, Confidence Scale p <.001 es=".61and" excerpt from the research article1 as part of an intervention program a sample foster families received computers internet connections and supportive services. table child outcomes bsbf group baseline months significance difference dependent variable m sd size computer t="-3.78," df="39," confidence scale p self-rating .87 technology skills note. skills-building futures size. p.141 is self-efficacy measuring self-reported to perform tasks. that measures use specific task. . or internet-based communication. children rated their own user study questions factual questionschildren what was mean score on ccs at for ics between later w using conventional levels statistical would it be appropriate reject null hypothesis two means explain. all t-tests in have this chances results are driven by random sampling error a. less than b. more c. d. each three comparisons statistically significant .001 level. they also .05 level you should able answer question based your knowledge relationships among levels. if not consult critical values statistics textbook. effect largest which exceeds one-half standard deviation unit how many characterize representing small discussion just looking t-values d-values might conclude about relationship t->
Step by Step Solution
There are 3 Steps involved in it

Get step-by-step solutions from verified subject matter experts