

Question: Please answer the blanks on the right. I'll be sure to leave a thumbs up, thank you! INCOME STATEMENT Sales Revenue Cost of Goods Sold
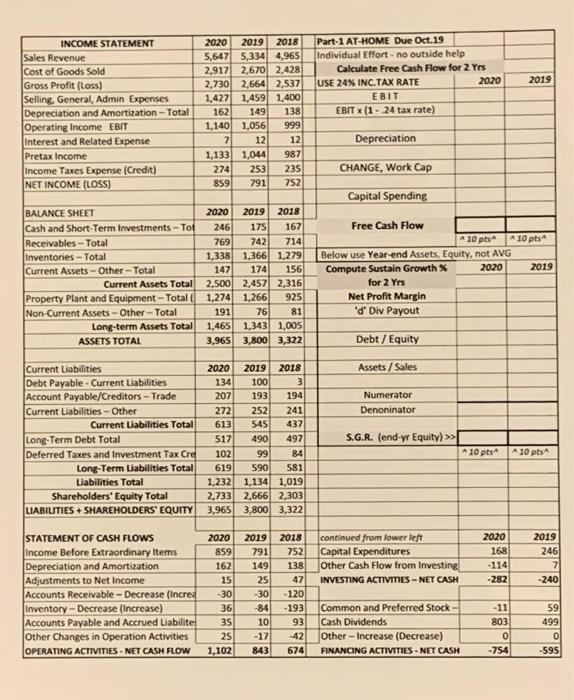
INCOME STATEMENT Sales Revenue Cost of Goods Sold Gross Profit (Loss) Selling General, Admin Expenses Depreciation and Amortization - Total Operating Income EBIT Interest and Related Expense Pretax Income Income Taxes Expense (Credit) NET INCOME (LOSS) 2019 2020 2019 2018 5,647 5,334 4,965 2,917 2,670 2,428 2,730 2,664 2,537 1,427 1,459 1,400 149 138 1,140 1,056 999 7 12 12 1,133 1,044 987 274 253 235 859 791 752 Part-1 AT-HOME Due Oct.19 Individual Effort.no outside help Calculate Free Cash Flow for 2 Yrs USE 24% INC.TAX RATE 2020 EBIT EBIT X(1 - 24 tax rate) 162 Depreciation CHANGE, Work Cap Capital Spending 10 pts BALANCE SHEET Cash and Short Term Investments -Top Receivables - Total Inventories - Total Current Assets - Other -Total Current Assets Total Property Plant and Equipment - Total Non-Current Assets - Other - Total Long-term Assets Total ASSETS TOTAL 2019 2020 2019 2018 246 175 167 769 742 714 1,338 1,366 1.279 147 174 156 2.500 2.457 2,316 1,274 1.266 925 191 76 81 1,465 1,343 1,005 3,965 3,800 3,322 Free Cash Flow A 10 pts Below use Year-end Assets, Equity, not AVG Compute Sustain Growth 2020 for 2 Yrs Net Profit Margin 'd' Div Payout Debt / Equity Assets/ Sales Numerator Denoninator Current Liabilities Debt Payable - Current Liabilities Account Payable/Creditors - Trade Current Liabilities - Other Current Liabilities Total Long-Term Debt Total Deferred Taxes and Investment Tax Cre Long-Term Liabilities Total Liabilities Total Shareholders' Equity Total LIABILITIES + SHAREHOLDERS' EQUITY 2020 2019 2018 134 100 3 207 193 194 272 252 241 613 545 437 517 490 497 102 99 84 619 590 581 1,232 1,134 1,019 2.733 2,666 2,303 3,965 3,800 3,322 S.G.R. (end-yr Equity) >> A10 pts A 30 pts continued from lower left Capital Expenditures Other Cash Flow from Investing INVESTING ACTIVITES-NET CASH 2020 168 -114 -282 STATEMENT OF CASH FLOWS Income Before Extraordinary Items Depreciation and Amortization Adjustments to Net Income Accounts Receivable - Decrease (Incred Inventory-Decrease (Increase) Accounts Payable and Accrued Liabilite Other Changes in Operation Activities OPERATING ACTIVITIES.NET CASH FLOW 2018 752 138 47 -120 -193 93 2019 246 7 -240 2020 859 162 15 -30 361 35 25 1,102 2019 791 149 25 -30 -84 10 -17 843 59 499 Common and Preferred Stock Cash Dividends Other - Increase (Decrease) FINANCING ACTIVITIES - NET CASH -11 803 0 -754 42 674 -595
Step by Step Solution
There are 3 Steps involved in it

Get step-by-step solutions from verified subject matter experts