

Question: Please answer the choices for the graph are johnston,smith,irwin A bond investor is analyzing the following annual coupon bonds: Issuing Company Irwin Enterprises Johnson Incorporated
Please answer the choices for the graph are johnston,smith,irwin
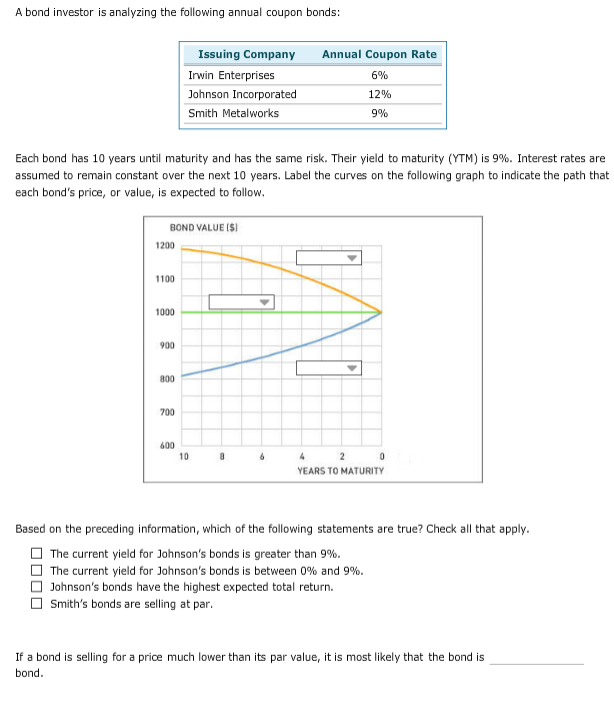
A bond investor is analyzing the following annual coupon bonds: Issuing Company Irwin Enterprises Johnson Incorporated Smith Metalworks Annual Coupon Rate 6% 12% 9% Each bond has 10 years until maturity and has the same risk. Their yield to maturity (YTM) is 9%. Interest rates are assumed to remain constant over the next 10 years. Label the curves on the following graph to indicate the path that each bond's price, or value, is expected to follow BOND VALUE (S 1200 1100 1000 900 800 700 600 10 YEARS TO MATURITY Based on the preceding information, which of the following statements are true? Check all that apply The current yield for Johnson's bonds is greater than 9%. The current yield for Johnson's bonds is between 0% and 9%. Johnson's bonds have the highest expected total return. O Smith's bonds are selling at par If a bond is selling for a price much lower than its par value, it is most likely that the bond is bond
Step by Step Solution
There are 3 Steps involved in it

Get step-by-step solutions from verified subject matter experts