

Question: please answer the first 3 questions (a,b,c) CASE 1 - AVIS RENT-A-CAR a. Conduct a horizontal analysis of the Balance Sheet and Income Statement items,
please answer the first 3 questions (a,b,c)
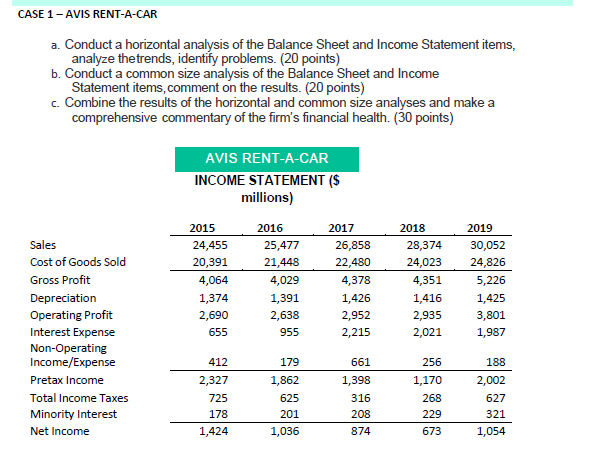
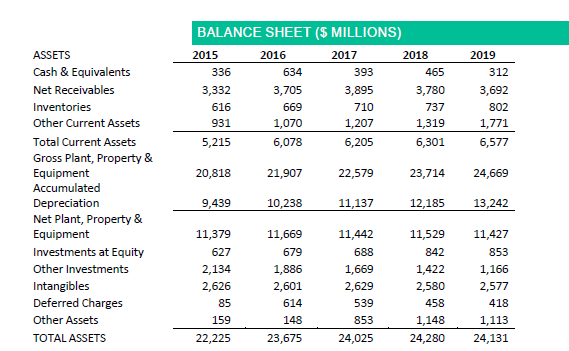
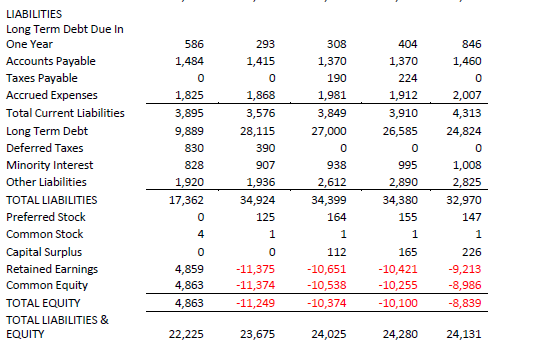
CASE 1 - AVIS RENT-A-CAR a. Conduct a horizontal analysis of the Balance Sheet and Income Statement items, analyze the trends, identify problems. (20 points) b. Conduct a common size analysis of the Balance Sheet and Income Statement items, comment on the results. (20 points) c. Combine the results of the horizontal and common size analyses and make a comprehensive commentary of the firm's financial health. (30 points) AVIS RENT-A-CAR INCOME STATEMENT ($ millions) 2015 24,455 20,391 4,064 1,374 2,690 655 2016 25,477 21,448 4,029 1,391 2,638 955 2017 26,858 22,480 4,378 1,426 2,952 2,215 2018 28,374 24,023 4,351 1,416 2,935 2,021 Sales Cost of Goods Sold Gross Profit Depreciation Operating Profit Interest Expense Non-Operating Income/Expense Pretax Income Total Income Taxes Minority Interest Net Income 2019 30,052 24,826 5,226 1,425 3,801 1,987 256 412 2,327 725 178 1,424 179 1,862 625 201 1,036 661 1,398 316 208 874 1,170 268 229 673 188 2,002 627 321 1,054 BALANCE SHEET($ MILLIONS) 2015 2016 2017 2018 336 634 393 465 3,332 3,705 3,895 3,780 616 669 710 737 931 1,070 1,207 1,319 5,215 6,078 6,205 6,301 2019 312 3,692 802 1,771 6,577 20,818 21,907 22,579 23,714 24,669 ASSETS Cash & Equivalents Net Receivables Inventories Other Current Assets Total Current Assets Gross Plant, Property & Equipment Accumulated Depreciation Net Plant, Property & Equipment Investments at Equity Other Investments Intangibles Deferred Charges Other Assets TOTAL ASSETS 9,439 10,238 11,137 12,185 13,242 11,379 627 2,134 2,626 85 159 22,225 11,669 679 1,886 2,601 614 148 23,675 11,442 688 1,669 2,629 539 853 11,529 842 1,422 2,580 458 1,148 24,280 11,427 853 1,166 2,577 418 1,113 24,131 24,025 586 1,484 0 1,825 LIABILITIES Long Term Debt Due In One Year Accounts Payable Taxes Payable Accrued Expenses Total Current Liabilities Long Term Debt Deferred Taxes Minority Interest Other Liabilities TOTAL LIABILITIES Preferred Stock Common Stock Capital Surplus Retained Earnings Common Equity TOTAL EQUITY TOTAL LIABILITIES & EQUITY 3,895 9,889 830 828 1,920 17,362 0 4 293 1,415 0 1,868 3,576 28,115 390 907 1,936 34,924 125 1 0 -11,375 -11,374 -11,249 308 1,370 190 1,981 3,849 27,000 0 938 2,612 34,399 164 1 112 -10,651 -10,538 -10,374 404 1,370 224 1,912 3,910 26,585 0 995 2,890 34,380 155 1 165 -10,421 -10,255 -10,100 846 1,460 0 2,007 4,313 24,824 0 1,008 2,825 32,970 147 1 226 -9,213 -8,986 -8,839 0 4,859 4,863 4,863 22,225 23,675 24,025 24,280 24,131 CASE 1 - AVIS RENT-A-CAR a. Conduct a horizontal analysis of the Balance Sheet and Income Statement items, analyze the trends, identify problems. (20 points) b. Conduct a common size analysis of the Balance Sheet and Income Statement items, comment on the results. (20 points) c. Combine the results of the horizontal and common size analyses and make a comprehensive commentary of the firm's financial health. (30 points) AVIS RENT-A-CAR INCOME STATEMENT ($ millions) 2015 24,455 20,391 4,064 1,374 2,690 655 2016 25,477 21,448 4,029 1,391 2,638 955 2017 26,858 22,480 4,378 1,426 2,952 2,215 2018 28,374 24,023 4,351 1,416 2,935 2,021 Sales Cost of Goods Sold Gross Profit Depreciation Operating Profit Interest Expense Non-Operating Income/Expense Pretax Income Total Income Taxes Minority Interest Net Income 2019 30,052 24,826 5,226 1,425 3,801 1,987 256 412 2,327 725 178 1,424 179 1,862 625 201 1,036 661 1,398 316 208 874 1,170 268 229 673 188 2,002 627 321 1,054 BALANCE SHEET($ MILLIONS) 2015 2016 2017 2018 336 634 393 465 3,332 3,705 3,895 3,780 616 669 710 737 931 1,070 1,207 1,319 5,215 6,078 6,205 6,301 2019 312 3,692 802 1,771 6,577 20,818 21,907 22,579 23,714 24,669 ASSETS Cash & Equivalents Net Receivables Inventories Other Current Assets Total Current Assets Gross Plant, Property & Equipment Accumulated Depreciation Net Plant, Property & Equipment Investments at Equity Other Investments Intangibles Deferred Charges Other Assets TOTAL ASSETS 9,439 10,238 11,137 12,185 13,242 11,379 627 2,134 2,626 85 159 22,225 11,669 679 1,886 2,601 614 148 23,675 11,442 688 1,669 2,629 539 853 11,529 842 1,422 2,580 458 1,148 24,280 11,427 853 1,166 2,577 418 1,113 24,131 24,025 586 1,484 0 1,825 LIABILITIES Long Term Debt Due In One Year Accounts Payable Taxes Payable Accrued Expenses Total Current Liabilities Long Term Debt Deferred Taxes Minority Interest Other Liabilities TOTAL LIABILITIES Preferred Stock Common Stock Capital Surplus Retained Earnings Common Equity TOTAL EQUITY TOTAL LIABILITIES & EQUITY 3,895 9,889 830 828 1,920 17,362 0 4 293 1,415 0 1,868 3,576 28,115 390 907 1,936 34,924 125 1 0 -11,375 -11,374 -11,249 308 1,370 190 1,981 3,849 27,000 0 938 2,612 34,399 164 1 112 -10,651 -10,538 -10,374 404 1,370 224 1,912 3,910 26,585 0 995 2,890 34,380 155 1 165 -10,421 -10,255 -10,100 846 1,460 0 2,007 4,313 24,824 0 1,008 2,825 32,970 147 1 226 -9,213 -8,986 -8,839 0 4,859 4,863 4,863 22,225 23,675 24,025 24,280 24,131
Step by Step Solution
There are 3 Steps involved in it

Get step-by-step solutions from verified subject matter experts