

Question: Please answer the first picture question. On pages 115 through 120 of the text, the statistical tool known as the chi-squared is described. This tool
Please answer the first picture question.
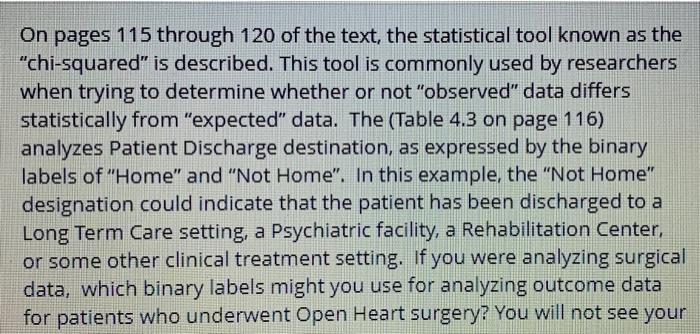
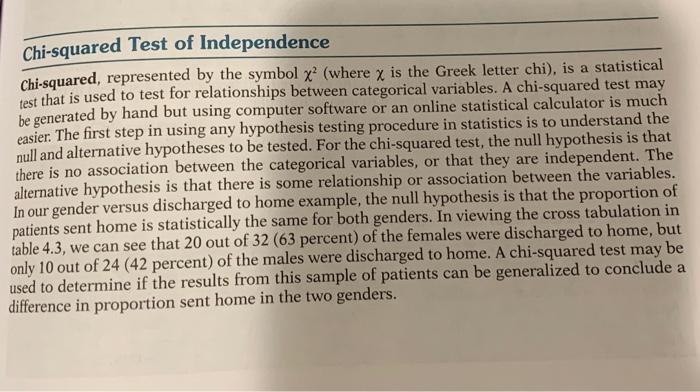
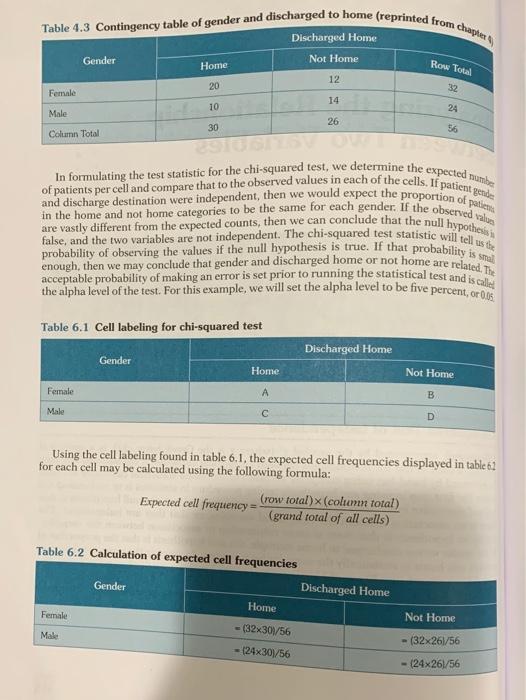
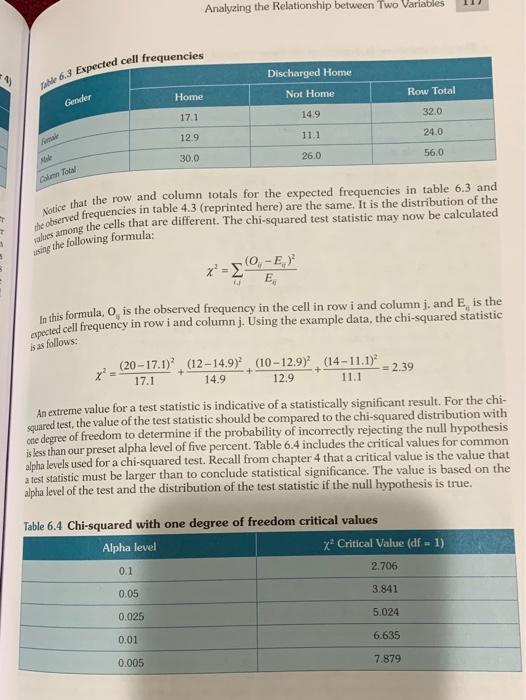
On pages 115 through 120 of the text, the statistical tool known as the "chi-squared is described. This tool is commonly used by researchers when trying to determine whether or not "observed" data differs statistically from "expected" data. The (Table 4.3 on page 116) analyzes Patient Discharge destination, as expressed by the binary labels of "Home" and "Not Home". In this example, the "Not Home" designation could indicate that the patient has been discharged to a Long Term Care setting, a Psychiatric facility, a Rehabilitation Center, or some other clinical treatment setting. If you were analyzing surgical data, which binary labels might you use for analyzing outcome data for patients who underwent Open Heart surgery? You will not see your Chi-squared Test of Independence Chi-squared, represented by the symbol x? (where x is the Greek letter chi), is a statistical test that is used to test for relationships between categorical variables. A chi-squared test may be generated by hand but using computer software or an online statistical calculator is much easier. The first step in using any hypothesis testing procedure in statistics is to understand the null and alternative hypotheses to be tested. For the chi-squared test, the null hypothesis is that there is no association between the categorical variables, or that they are independent. The alternative hypothesis is that there is some relationship or association between the variables. In our gender versus discharged to home example, the null hypothesis is that the proportion of patients sent home is statistically the same for both genders. In viewing the cross tabulation in table 4.3, we can see that 20 out of 32 (63 percent) of the females were discharged to home, but only 10 out of 24 (42 percent) of the males were discharged to home. A chi-squared test may be used to determine if the results from this sample of patients can be generalized to conclude a difference in proportion sent home in the two genders. Table 4.3 Contingency table of gender and discharged to home (reprinted from chaper Discharged Home Gender Not Home Home Row Total 12 20 32 Female 14 10 24 Male 26 30 56 Column Total and discharge destination were independent, then we would expect the proportion of patients of patients per cell and compare that to the observed values in each of the cells. If patient gende In formulating the test statistic for the chi-squared test, we determine the expected the in the home and not home categories to be the same for each gender. If the observed values are vastly different from the expected counts, then we can conclude that the null hypothesis false, and the two variables are not independent. The chi-squared test statistic will tell us the enough, then we may conclude that gender and discharged home or not home are related. The probability of observing the values if the null hypothesis is true. If that probability is smal the alpha level of the test. For this example, we will set the alpha level to be five percent, orelles acceptable probability of making an error is set prior to running the statistical test and is calles Table 6.1 Cell labeling for chi-squared test Discharged Home Gender Home Not Home Female A B Male D Using the cell labeling found in table 6.1, the expected cell frequencies displayed in table 61 for each cell may be calculated using the following formula: Expected cell frequency="row total)x (column total) (grand total of all cells) Table 6.2 Calculation of expected cell frequencies Discharged Home Gender Home Female Not Home - (32x30/56 Male - 24x30/56 - (32x26/56 - (24x26/56 II Analyzing the Relationship between Two Variables 6.3 Expected cell frequencies Discharged Home Home Not Home Row Total Gender 17.1 14.9 32.0 12.9 11.1 24.0 30.0 26.0 56.0 Co Tocal Notice that the row and column totals for the expected frequencies in table 6.3 and the observed frequencies in table 4.3 (reprinted here) are the same. It is the distribution of the sales among the cells that are different. The chi-squared test statistic may now be calculated 2 3 sing the following formula: -0,-E,) E, In this formula, 0, is the observed frequency in the cell in row i and column j. and E is the experted cell frequency in row i and column j. Using the example data, the chi-squared statistic is as follows: + (20-17.1) (12-14.9) (10-12.9) (14 - 11.1) -= 2.39 17.1 14.9 12.9 11.1 An extreme value for a test statistic is indicative of a statistically significant result. For the chi- squared test, the value of the test statistic should be compared to the chi-squared distribution with one degree of freedom to determine if the probability of incorrectly rejecting the null hypothesis is less than our preset alpha level of five percent. Table 6.4 includes the critical values for common alpha levels used for a chi-squared test. Recall from chapter 4 that a critical value is the value that a test statistic must be larger than to conclude statistical significance. The value is based on the alpha level of the test and the distribution of the test statistic if the null hypothesis is true. Table 6.4 Chi-squared with one degree of freedom critical values Alpha level x* Critical Value (df = 1) 0.1 2.706 0.05 3.841 0.025 5.024 0.01 6.635 0.005 7.879
Step by Step Solution
There are 3 Steps involved in it
1 Expert Approved Answer
Step: 1 Unlock

Question Has Been Solved by an Expert!
Get step-by-step solutions from verified subject matter experts
Step: 2 Unlock
Step: 3 Unlock