

Question: please answer the following :) 4. Below is the box plot of a data set. Use this box plot to answer the following questions: *H3
please answer the following :)
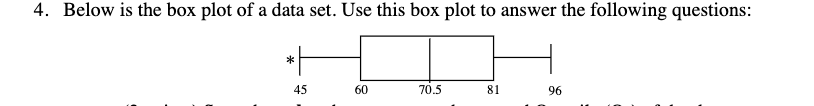

4. Below is the box plot of a data set. Use this box plot to answer the following questions: *H3 45 60 70.5 Bl 96 b. (3 points) Would the box plot suggest any outliers in the data set? Explain
Step by Step Solution
There are 3 Steps involved in it
1 Expert Approved Answer
Step: 1 Unlock

Question Has Been Solved by an Expert!
Get step-by-step solutions from verified subject matter experts
Step: 2 Unlock
Step: 3 Unlock