

Question: Please Answer the following four questions: The following data represent the heights (in inches) of 14 students in Ms. Warner's math class: 65. 63, 68,
Please Answer the following four questions:
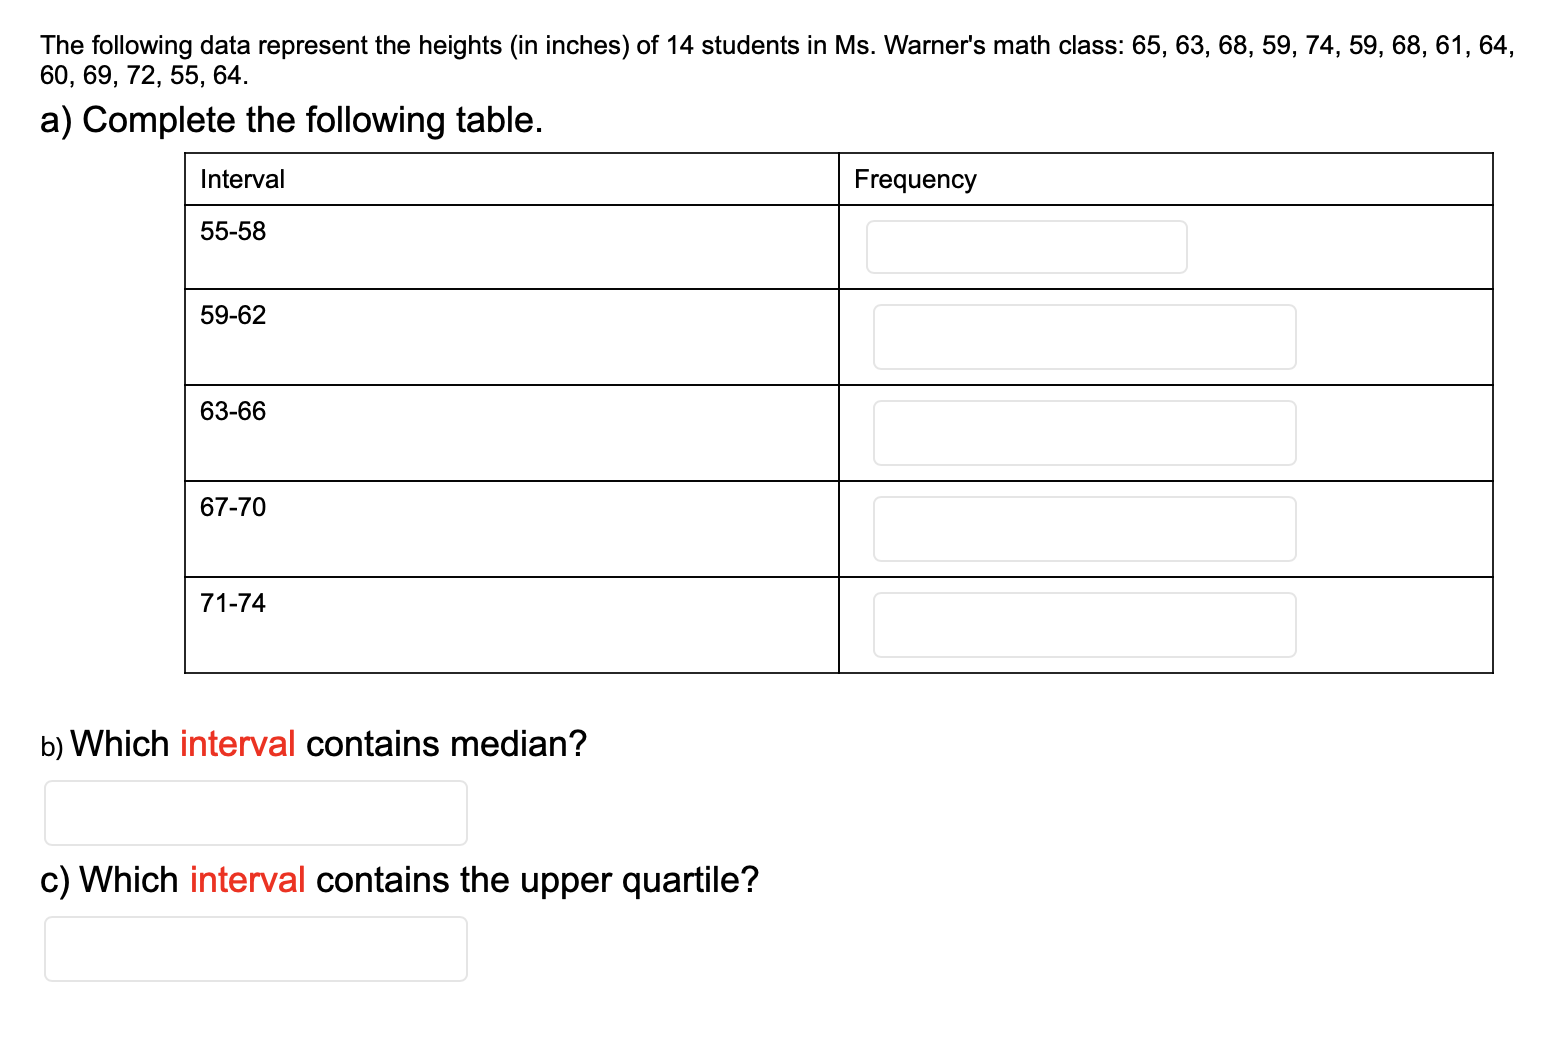
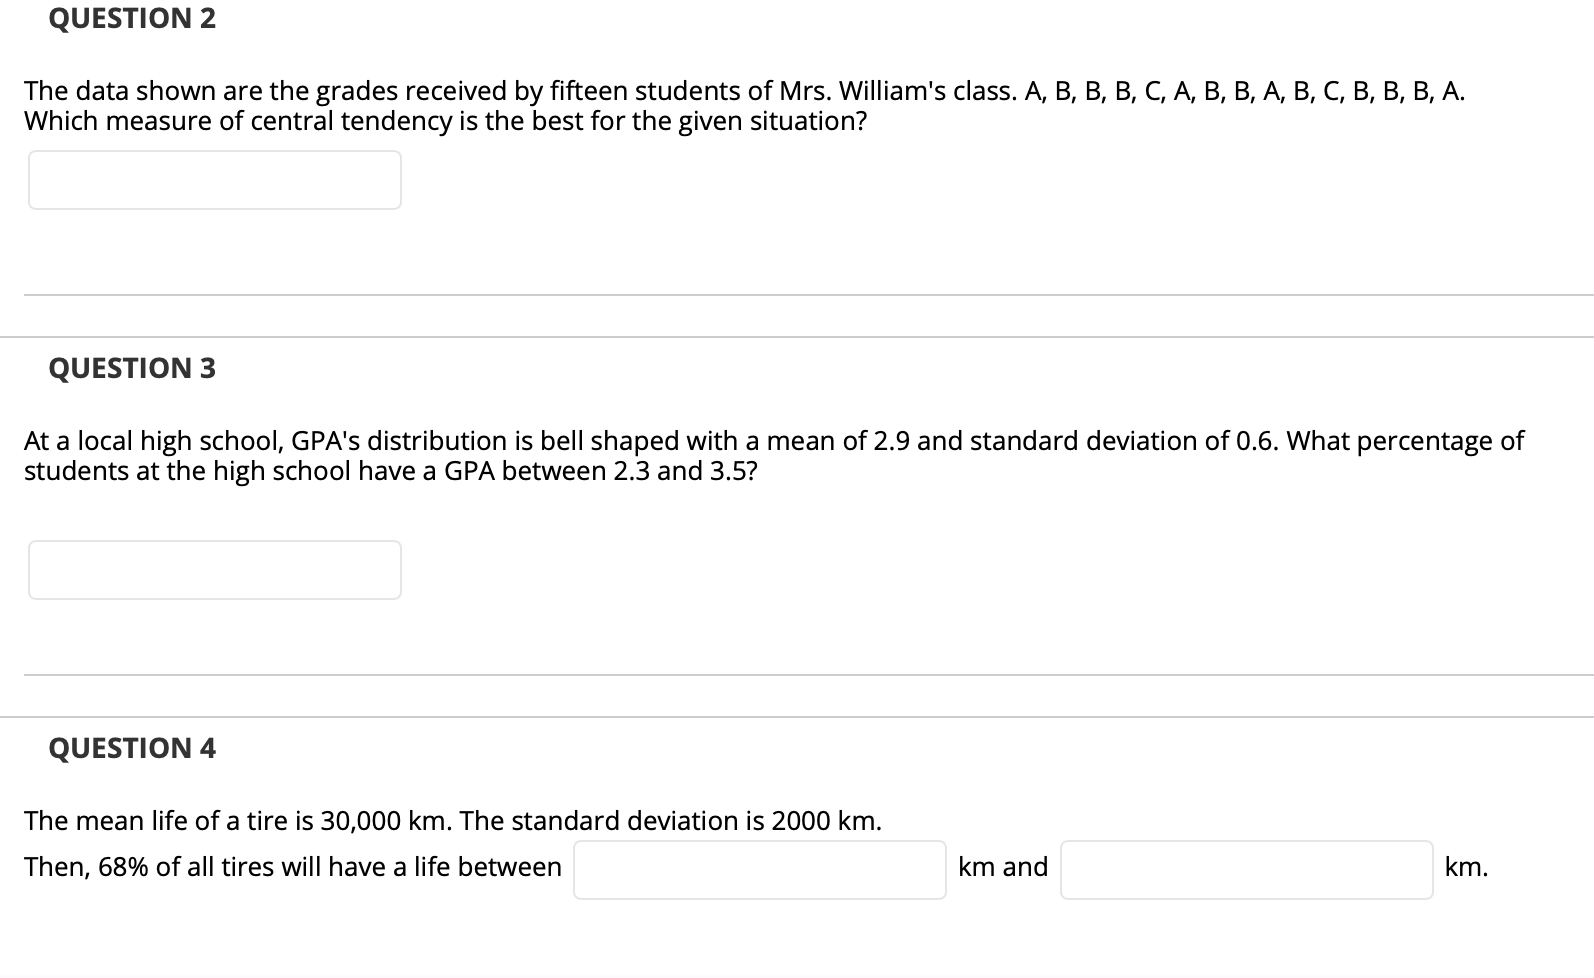
The following data represent the heights (in inches) of 14 students in Ms. Warner's math class: 65. 63, 68, 59, 74, 59. 68. 61, 64. 60, 69, 72, 55, 64. a) Complete the following table. _ b) Which interval contains median? c) Which interval contains the upper quartile? QUESTION 2 The data shown are the grades received by fifteen students of Mrs. William's class. A, B, B, B, C, A, B, B, A, B, C, B, B, B, A. Which measure of central tendency is the best for the given situation? QUESTION 3 At a local high school, GPA's distribution is bell shaped with a mean of 2.9 and standard deviation of 0.6. What percentage of students at the high school have a GPA between 2.3 and 3.5? QUESTION 4 The mean life of a tire is 30,000 km. The standard deviation is 2000 km. Then, 68% of all tires will have a life between km and km
Step by Step Solution
There are 3 Steps involved in it

Get step-by-step solutions from verified subject matter experts