Question: Please answer the following information using the content below. Differentiate between the concepts of Book Valuation, Liquidation Valuation, and Replacement cost Valuation. Explain the discounted

Please answer the following information using the content below.

  1. Differentiate between the concepts of Book Valuation, Liquidation Valuation, and Replacement cost Valuation.
  2. Explain the discounted cash flow approach to valuation.
  3. Differentiate between the General Dividend Valuation Model, the Constant Growth Model, and the Nonconstant Growth Model.
  4. Use the constant growth model to value stocks, estimate required rates of return, and calculate implied growth rates, and the nonconstant growth model to value stocks.
  5. Explain some of the difficulties associated with using dividend valuation models to value stocks.
  6. Explain the difference between a regular price earnings ratio and a forward price earnings ratio, and know how both are calculated.
  7. Provide a detailed explanation for why price earnings ratios differ across firms.
  8. Discuss the relationship between price earnings ratios and investment opportunities.
  9. Apply the earnings multiplier model to help in arriving at an investment recommendation on a stock.
  10. Explain the approach used by Niederhoffer & Regan to illustrate the importance of unexpected earnings in driving stock prices, and the results of their study.
  11. How analysts can use their earnings forecasts to arrive at an investment recommendation.
  12. Identify and discuss a number of factors that should be considered when evaluating how a given stock is likely to perform over the next year or two.
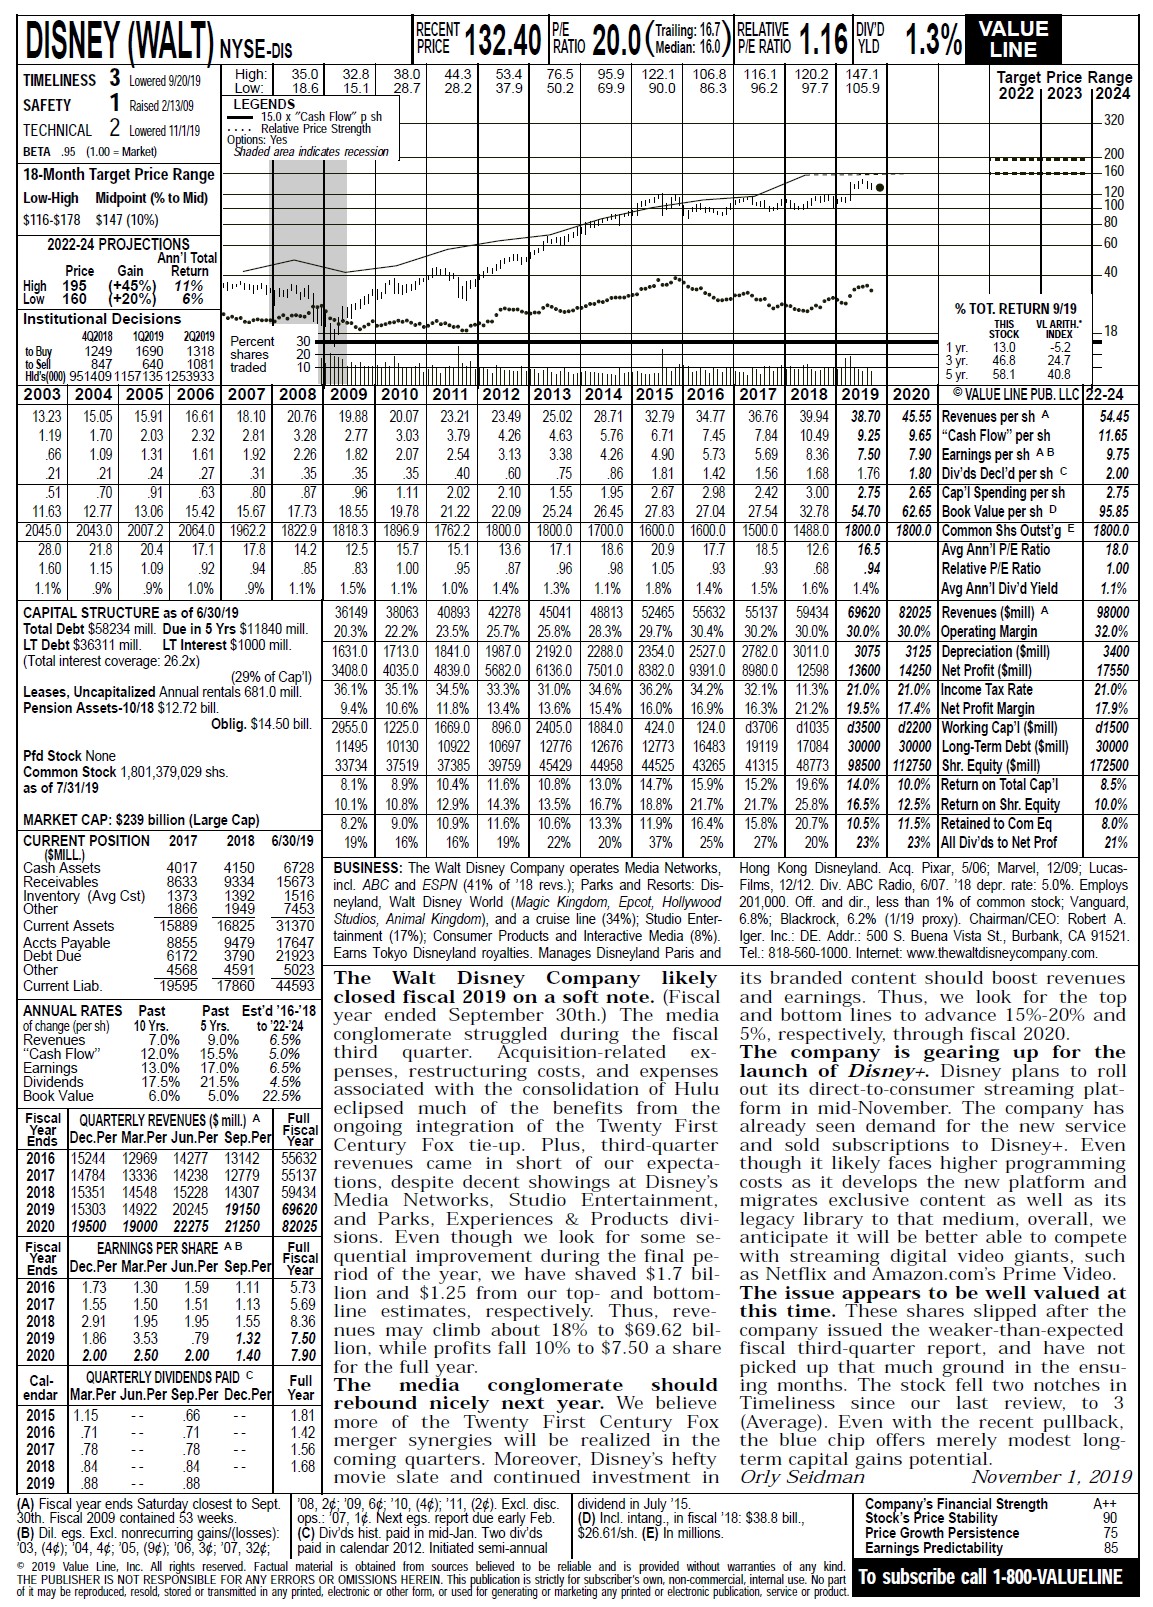
  13. Explain the company and industry reports provided by Value Line in some detail.
  14. Explain different methods for estimating earnings per share, including the associated calculations.
  15. Explain different methods for estimating long-term growth rates in earnings per share and dividends per shares, including the associated calculations.
  16. Explain three techniques that can be used to estimate fair required rates of return for a security, and the associated calculations.
  17. Discuss factors to consider when projecting the future price earnings ratio for a firm.
  18. Explain the relationship between the economic climate and the stock market.

FUNDAMENTAL ANALYSIS AND COMMION STOCK VALUATION

(Chapters 17 and 18 FIN5515 Notes)

I. Alternative Valuation Methods

The focus of fundamental analysis is on projecting a firm's future earnings per share (eps) and dividends per share (dps) streams and on assessing the risk associated with the firm's common stock. These estimates may be used in estimating the true "intrinsic value" value of the firm's stock, which can then be compared to the current stock price to arrive at an investment recommendation on the stock. Alternatively, these estimates along with other factors can be used to estimate a reasonable price/earnings ratio for a stock, which then can be compared to the actual price/earnings ratio to arrive at an investment decision. Before considering how to estimate the intrinsic value of a stock further, a couple of other valuation measures are considered.

A. Book Value Per Share

The book value of a share of stock can be calculated using the following equation:

BV = Total Shareholders' Equity from Balance Sheet / # of Shares Outstanding

Total shareholders' equity consists of the sum of the Common Stock, Paid-in-Surplus, and Retained Earnings Accounts on the right hand side of the balance sheet. It essentially represents the total equity capital contributed by shareholders as of a point in time. Thus, in a sense the book value per share can be interpreted as the average capital contributed per share. Book values and market values frequently differ considerably, with market values typically, but not always, greater than book values. Since market values depend upon the projected future performance of the company, the risk of the company, etc., it is not surprising that the two values often differ markedly. To get a feel for the market-to-book ratio for some companies, go to Yahoo!Finance, enter a ticker symbol for a company, and click on "Statistics" to find the company's price/book ratio.

http://finance.yahoo.com/

As mentioned in Unit 6, higher growth firms generally have higher market-to-book ratios than lower growth firms. But historically speaking, high book-to-market stocks (i.e., low market-tobook stocks) have outperformed the low book-to-market stocks. Though it may be useful to know the book value of a stock for various reasons, it does not tell us much about what a stock should be selling for now, and therefore it is not particularly helpful for estimating the intrinsic value of a stock.

B. Liquidation Value

A company's liquidation value would equal the cash flow generated from liquidating the firm's assets less the amount required to pay off the firm's liabilities. Dividing this result by the number of outstanding shares would produce the liquidation value per share. The only time the per share liquidation value would be pertinent for estimating the intrinsic value of the stock is when it exceeds the estimated stock value obtained from valuing the firm as a going concern. A case in point might be if a firm owned a substantial amount of real estate that has a market value far greater than the value on the balance sheet. The stock price from valuing the firm as a going concern might actually be less than the liquidation value because the true value of the land is not reflected in the price. This is why liquidation value is sometimes considered a "floor" on the value of the stock. Liquidation valuation generally takes on added importance if a firm is approaching bankruptcy, but in normal circumstances it does not help us much when estimating the intrinsic value of the stock.

C. Replacement Cost

Replacement cost valuation is simply the dollar cost of replacing the firm's assets less its liabilities. Dividing by the number of outstanding shares would put this on a per share basis. Some argue that market values cannot exceed replacement values by too much for too long because competitors could replicate the firm with the increased competition ultimately lowering the stock price. Actually carrying out such a replication might be a lot more difficult than the above position assumes, however. As a rule, replacement cost estimates provide little help for estimating the intrinsic value of a share of stock.

II. Intrinsic Value Versus Market Value

Suppose you were offered an investment that promised to pay you $1,000 one year from today. How much would you be willing to pay for the investment? It depends upon what your required rate of return is on the investment? For example, let's assume that you assess the likelihood of getting paid, consider interest rates on one-year CDs, etc., and arrive at 10 percent as a fair return. Then you should be willing to pay $1,000/1.10 = $909.09. Note, if you multiply 1.10 times $909.09, you get $1,000. In other words, you would pay an amount such that if you received the promised payment, you make exactly 10 percent on your investment. Though this is a simple valuation problem, the underlying logic is identical to that employed in the most common approach for estimating the intrinsic value of a share of stock, which we consider next.

A. Discounted Cash Flow Approach to Security Valuation

The Discounted Cash Flow Approach to Security Valuation is the most logical approach for valuing most financial securities. Investors purchase stocks to increase their wealth. So to determine the amount that one should be willing to pay for a given stock at a point in time, just estimate the cash flows the stock is projected to provide in the future (both magnitudes and timing) and discount these back to the present by a fair rate of return. In step-by-step fashion, the valuation process is as follows:

  1. Estimate the future cash flows the security is expected to provide.
  2. Determine a "fair" required rate of return (k) for the security (perhaps using CAPM).
  3. Discount the estimated expected cash flows to the present by the fair required rate of return, k.

So let's apply this approach to common stocks.

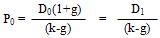
B. Common Stock Valuation - Dividend Valuation Models (DVM)

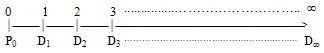
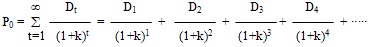
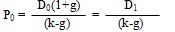
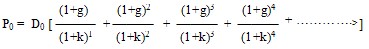
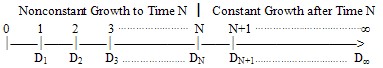
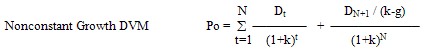
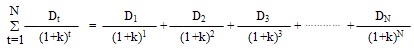
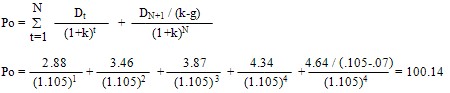
Valuing common stocks is more difficult than the simple valuation problem above for a couple of reasons. To add intuition, let's consider the valuation process for stocks versus bonds, which will be covered later in the course. First, the only cash flows that common stocks pay are cash dividends. Future dividends are not known, and thus have to be estimated. Since there is no terminal date, we have to project future dividends forever. (How long is Disney going to be around?) When valuing bonds, the magnitudes and timing of the promised cash flows are generally known, and there is a specified maturity date. Second, it is more difficult to accurately estimate the appropriate required rate of return on a common stock than for a bond. This is primarily because it is easier to assess and therefore price the risk of a bond than it is a stock. Actually, we will see later that if you know the price a bond is selling at and what the promised cash flows are, you can readily determine the market determined required rate of return on the bond (yield to maturity). Nearly all firms that pay cash dividends do so quarterly, but for simplicity, we will assume annual dividends paid at the end of each year. The problem we are attempting to solve can be illustrated as follows:

Please answer the following information using thePlease answer the following information using thePlease answer the following information using thePlease answer the following information using thePlease answer the following information using thePlease answer the following information using thePlease answer the following information using thePlease answer the following information using thePlease answer the following information using thePlease answer the following information using thePlease answer the following information using thePlease answer the following information using thePlease answer the following information using thePlease answer the following information using thePlease answer the following information using thePlease answer the following information using thePlease answer the following information using thePlease answer the following information using thePlease answer the following information using the
2 Po D18 D1 D3 DA Po = E t=1 (1+k) (1 +h) (1+1) (1+k) (1+k)+\f\f(1+k) (1+g) (1+g)- (1 +g ) (1+g)+ Po = Do [1 + + + + (1+g) (1+k) (1+k)- (1 +k) (1+k)(1+k) (1+g) }= Do and rearrange terms to get the constant growth model: (1+g) (1+g)Do(1+g D1 = Po k-g K-g\f\f\f\f\f\f\f\f\f\fDISNEY (WALT) VALUE NYSE-DIS RECENT 132 40 RATIO 20.0 Trailing: 16.7 RELATIVE PRICE Median: 16.0 |PE RATIO 1,16 DIVD 1.3% LINE TIMELINESS 3 Lowered 9/20/19 High: 35.0 32.8 38.0 44.3 53.4 76.5 95.9 122.1 106.8 116.1 120.2 147.1 Low: 18.6 15.1 28.7 28.2 37.9 50.2 69.9 90.0 86.3 96.2 97.7 105.9 Target Price Range 1 Raised 2/13/09 2022 | 2023 |2024 SAFETY LEGENDS 15.0 x "Cash Flow" p sh - 320 TECHNICAL 2 Lowered 11/1/19 . Relative Price Strength BETA .95 (1.00 = Market) Shaded area indicates recession - 200 18-Month Target Price Range 160 Low-High Midpoint (% to Mid) 120 . 100 $116-$178 $147 (10%) -80 2022-24 PROJECTIONS -60 Ann'l Total Price Gain Return 40 High 195 (+45 70) 11% Low 160 +20%) 6% % TOT. RETURN 9/19 Institutional Decisions THIS VL ARITH." 402018 102019 2Q2019 INDEX -18 1690 1318 Percent 1249 130 to Buy 847 1081 shares 640 3 yr. 46 8 24.7 Hid's(000) 951409 1 157 135 1253933 trade 10 5 Vr . 58.1 10 8 2003 2004 2005 2006 2007 2008 2009 2010 2011 2012 2013 2014 2015 2016 2017 2018 2019 2020 @VALUE LINE PUB. LLC 22-24 13.23 15.05 15.91 16.61 18.10 20.76 19.88 20.07 23.49 25.02 28.71 32.79 34.77 36.76 39.94 38.70 45.55 Revenues per sh A 54.45 1.19 1.70 2.03 2.32 2.81 3.28 2.77 3.03 3.79 4.26 4.63 5.76 6.71 7.45 7.84 10.49 9.25 9.65 "Cash Flow" per sh 11.65 .66 1.09 1.31 1.61 1 92 2.26 187 2.07 2.54 3.13 3.38 4 26 4.90 5.73 5.69 8.36 7.50 7.90 Earnings per sh A B 9.75 21 21 1 24 27 31 35 35 35 40 60 75 .86 1.81 1.42 1.56 1.68 1.76 1.80 Div'ds Decl'd per sh C 2.00 70 .91 1 63 80 87 96 1.11 2.02 2.10 1.55 1.95 2.67 2.98 2.42 3.00 2.75 2.65 Cap'l Spending per sh 2.75 11.63 12.77 13.06 15.42 15.67 17.73 18.55 19.78 21.22 22.09 25.24 26.45 27.83 27.04 27.54 32.78 54.70 62.65 Book Value per sh D 95.85 2045.0 2043.0 2007.2 2064.0 1962.2 1822.9 1818.3 1896.9 1762.2 1800.0 1800.0 1700.0 1600.0 1600.0 1500.0 1488.0 1800.0 1800.0 Common Shs Outstig E 1800.0 28.0 21.8 20.4 17.1 17.8 14.2 12.5 15.7 15.1 13.6 17.1 18.6 20.9 17.7 18.5 12.6 16.5 Avg Ann'l P/E Ratio 18.0 1.60 1.15 1.09 92 94 85 83 1.00 95 87 96 98 1.05 93 93 68 .94 Relative P/E Ratio 1.00 9% 1.0% .9% 1.1% 1.5% 1.1% 1.0% 1.4% 1.3% 1.1% 1.8% 1.4% 1.5% 1.6% 1.4% Avg Ann'l Div'd Yield 1.1% CAPITAL STRUCTURE as of 6/30/19 36149 38063 40893 42278 45041 48813 52465 55632 55137 59434 69620 82025 Revenues ($mill) A 98000 Total Debt $58234 mill. Due in 5 Yrs $11840 mill. 20.3% 22.2% 23.5% 25.7% 25.8% 28.3% 29.7% 30.4% 30.2% 30.0% 30.0% 30.0% Operating Margin 32.0% LT Debt $36311 mill. LT Interest $1000 mill. 1631.0 1713.0 1841.0 1987.0 2192.0 2288.0 2354.0 2527.0 2782.0 3011.0 307 3125 Depreciation ($mill) 3400 (Total interest coverage: 26.2x) (29% of Cap'l) 3408.0 4035.0 4839.0 5682.0 6136.0 7501.0 8382.0 9391.0 8980.0 12598 13600 14250 Net Profit ($mill) 17550 Leases, Uncapitalized Annual rentals 681.0 mill. 36.1% 35.1% 34.5% 33.3% 31.0% 34.6% 36.2% 34.2% 32.1% 11.3% 21.0% 21.0% Income Tax Rate 21.0% Pension Assets-10/18 $12.72 bill. 94% 10.6% 11.8% 13.4% 13.6% 15.4% 16.0% 16.9% 16.3% 21.2% 19.5% 17.4% Net Profit Margin 17.9% Oblig. $14.50 bill. 2955.0 1225.0 1669.0 896.0 2405.0 1884.0 424.0 124.0 d3706 d1035 d3500 d2200 Working Cap'l ($mill) d1500 11495 10697 Pfd Stock None 10130 10922 12776 12676 12773 16483 19119 17084 30000 30000 Long-Term Debt ($mill) 30000 Common Stock 1,801,379,029 shs. 33734 37519 37385 39759 45429 44958 44525 43265 41315 48773 98500 112750 Shr. Equity ($mill) 72500 as of 7/31/19 8.1% 8.9% 10.4% 11.6% 10.8% 13.0% 14.7% 15.9% 15.2% 19.6% 14.0% 10.0% Return on Total Cap'l 8.5% 10.1% 10.8% 12.9% 14.3% 1 13.5% 16.7% 18.8% 21.7% 21.7% 25.8% 16.5% 12.5% Return on Shr. Equity 10.0% MARKET CAP: $239 billion (Large Cap) 8.2% 9.0% 10.9% 11.6% 10.6% 13.3% 11.9% 16.4% 15.8% 20.7% 10.5% 11.5% Retained to Com Eq 8.0% CURRENT POSITION 2017 2018 6/30/19 19% 16% 16% 19% 22% 20% 37% 25% 27% 20% 23% 21% ($MILL.) 23% All Div'ds to Net Prof Cash Assets 401/ 4150 8633 9334 6728 BUSINESS: The Walt Disney Company operates Media Networks, Hong Kong Disneyland. Acq. Pixar, 5/06; Marvel, 12/09; Lucas- Receivables 15673 incl. ABC and ESPN (41% of '18 revs.); Parks and Resorts: Dis- Films, 12/12. Div. ABC Radio, 6/07. '18 depr. rate: 5.0%. Employs Inventory (Avg Cst) 1295 1516 Other 1866 7453 neyland, Walt Disney World (Magic Kingdom, Epcot, Hollywood 201,000. Off. and dir., less than 1% of common stock; Vanguard Current Assets 15889 16825 31370 Studios, Animal Kingdom), and a cruise line (34%); Studio Enter- 6.8%; Blackrock, 6.2% (1/19 proxy). Chairman/CEO: Robert A Accts Payable 8855 9479 17647 tainment (17%); Consumer Products and Interactive Media (8%). Iger. Inc.: DE. Addr.: 500 S. Buena Vista St., Burbank, CA 91521. Debt Due 6172 3790 21923 ms Tokyo Disneyland royalties. Manages Disneyland Paris and Tel.: 818-560-1000. Internet: www.thewaltdisneycompany.com. Other 4568 4591 5023 Current Liab 19595 17860 44593 e Walt Disney y Company likely its branded content should boost revenues ANNUAL RATES Past closed fiscal 2019 on a soft note. (Fiscal and earnings. Thus, we look for the top Past Est'd '16-'18 of change (per sh) 10 Yrs. 5 Yrs. to '22-24 year ended September 30th.) The media and bottom lines to advance 15%-20% and Revenues 7.0% 9.0% 6.5% conglomerate struggled during the fiscal 5%, respectively, through fiscal 2020. "Cash Flow 12.0% 15 5% 5 0% third quarter. Acquisition-related ex- The company is gearing up for the Earnings 13.0% 17.0% 6.5% Dividends 17.5% 21.5% 4.5% penses, restructuring costs, and expenses launch of Disney+. Disney plans to roll Book Value 6.0% 5.0% 22.5% associated with the consolidation of Hulu out its direct-to-consumer streaming plat- Fiscal | QUARTERLY REVENUES ($ mill.) A Full eclipsed much of the benefits from the form in mid-November. The company has Year Ends Dec.Per Mar.Per Jun.Per Sep.Per Year ongoing integration of the Twenty First already seen demand for the new service 2016 15244 12969 14277 13142 55632 Century Fox tie-up. Plus, third-quarter and sold subscriptions to Disney+. Even 2017 14784 13336 14238 12779 55137 revenues came in short of our expecta- though it likely faces higher programming 2018 15351 14548 15228 14307 59434 tions, despite decent showings at Disney's costs as it develops the new platform and 2019 15303 14922 20245 19150 6962 Media Networks, Studio Entertainment, migrates exclusive content as well as its 2020 19500 19000 22275 21250 82025 and Parks, Experiences & Products divi- legacy library to that medium, overall, we Fiscal EARNINGS PER SHARE A B Full sions. Even though we look for some se- anticipate it will be better able to compete Year is Dec.Per Mar.Per Jun.Per Sep.Per Fiscal quential improvement during the final pe- with streaming digital video giants, such Ends Year riod of the year, we have shaved $1.7 bil- as Netflix and Amazon.com's Prime Video. 2016 1.73 1.30 1.59 1.11 5.73 2017 1.55 1.50 1.51 1.13 5.69 lion and $1.25 from our top- and bottom- The issue appears to be well valued at 2018 2.91 1 95 1 95 1.55 8.36 line estimates, respectively. Thus, reve- this time. These shares slipped after the 2019 1.86 353 1.32 7.50 nues may climb about 18% to $69.62 bil- company issued the weaker-than-expected 2020 2.00 2.50 2.00 1.40 7.90 lion, while profits fall 10% to $7.50 a share fiscal third-quarter report, and have not QUARTERLY DIVIDENDS PAID C for the full year. picked up that much ground in the ensu- Cal- Full Mar.Per Jun.Per Sep.Per Dec.Per Year The media endar conglomerate should ing months. The stock fell two notches in rebound nicely next year. We believe 2015 1.15 Timeliness since our last review, to 3 -66 1.81 2016 .71 71 1.42 more of the Twenty First Century Fox (Average). Even with the recent pullback, 2017 78 78 1.56 merger synergies will be realized in the the blue chip offers merely modest long- 2018 .84 84 168 coming quarters. Moreover, Disney's hefty term capital gains potential. 2019 movie slate and continued investment in Orly Seidman November 1, 2019 (A) Fiscal year ends Saturday closest to Sept 08, 20; '09, 6c; '10, (4#); '11, (24). Excl disc. dividend in July '15. Company's Financial Strength 30th. Fiscal 2009 contained 53 weeks. ops.: '07, 1c. Next egs. report due early Feb. (D) Incl. intang., in fiscal '18: $38.8 bill., Stock's Price Stability 90 (B) Dil. egs. Excl nonrecurring gains/(losses): (C) Div'ds hist. paid in mid-Jan. Two div'ds $26.61/sh. (E) In millions. Price Growth Persistence 75 03, (4#); '04, 4#; '05, (94); '06, 34; '07, 320; paid in calendar 2012. Initiated semi-annual Earnings Predictability 85 2019 Value Line, Inc. All rights reserved. Factual material is obtained from sources believed to be reliable and is provided without warranties of any kind. HE PUBLISHER IS NOT RESPONSIBLE FOR ANY ERRORS OR OMISSIONS HEREIN. This publication is strictly for subscriber's own, non-commercial, internal use. No part To subscribe call 1-800-VALUELINE it may be reproduced, resold, stored or transmitted in any printed, electronic or other form, or used for generating or marketing any printed or electronic publication, service or product.\f

Step by Step Solution

There are 3 Steps involved in it

1 Expert Approved Answer
Step: 1 Unlock blur-text-image
Question Has Been Solved by an Expert!

Get step-by-step solutions from verified subject matter experts

Step: 2 Unlock
Step: 3 Unlock

Students Have Also Explored These Related Accounting Questions!