

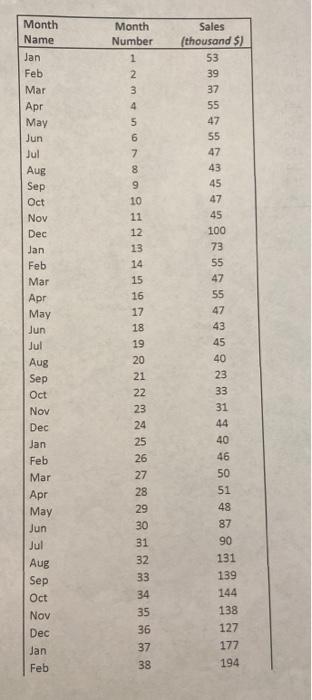
Question: please answer the following question and it's corresponding parts using the information below in the table. thank you! begin{tabular}{|lll|} Mar & 39 & 192
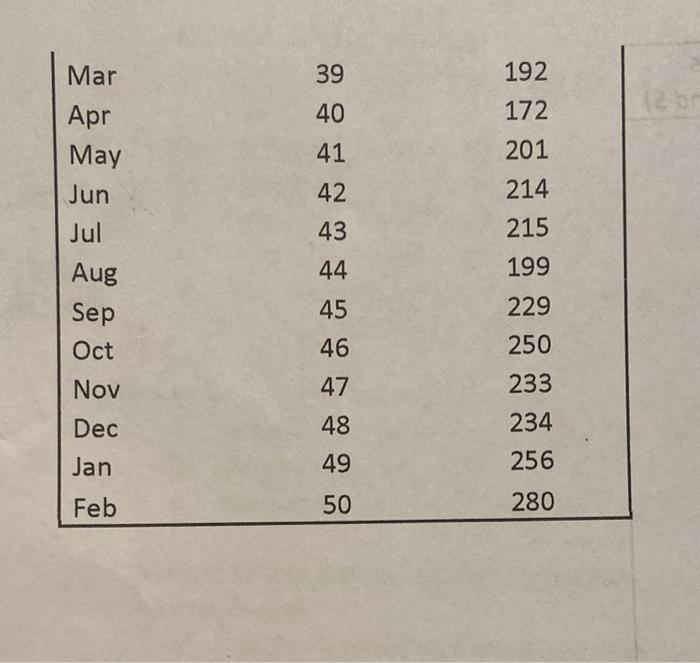


\begin{tabular}{|lll|} Mar & 39 & 192 \\ Apr & 40 & 172 \\ May & 41 & 201 \\ Jun & 42 & 214 \\ Jul & 43 & 215 \\ Aug & 44 & 199 \\ Sep & 45 & 229 \\ Oct & 46 & 250 \\ Nov & 47 & 233 \\ Dec & 48 & 234 \\ Jan & 49 & 256 \\ Feb & 50 & 280 \\ \hline \end{tabular} 3- Perform a moving average forecast. a. Experiment with different time windows. Find the best one based on MAPE b. Plot the chosen forecast and actual data overlaid. c. Provide MAD and MAEE. d. How does this method compare to the naive forecast? e. Are there changes in the time series where? 3- Perform a moving average forecast. a. Experiment with different time windows. Find the best one based on MAPE. b. Plot the chosen forecast and actual data overlaid. c. Provide MAD and MAPE. d. How does this method compare to the naive forecast? e. Are there changes in the time series where
Step by Step Solution
There are 3 Steps involved in it

Get step-by-step solutions from verified subject matter experts