

Question: Please answer the following question using the formulas provided 1. Two portfolios A and B. Their returns across different states of economy are described below:
Please answer the following question using the formulas provided
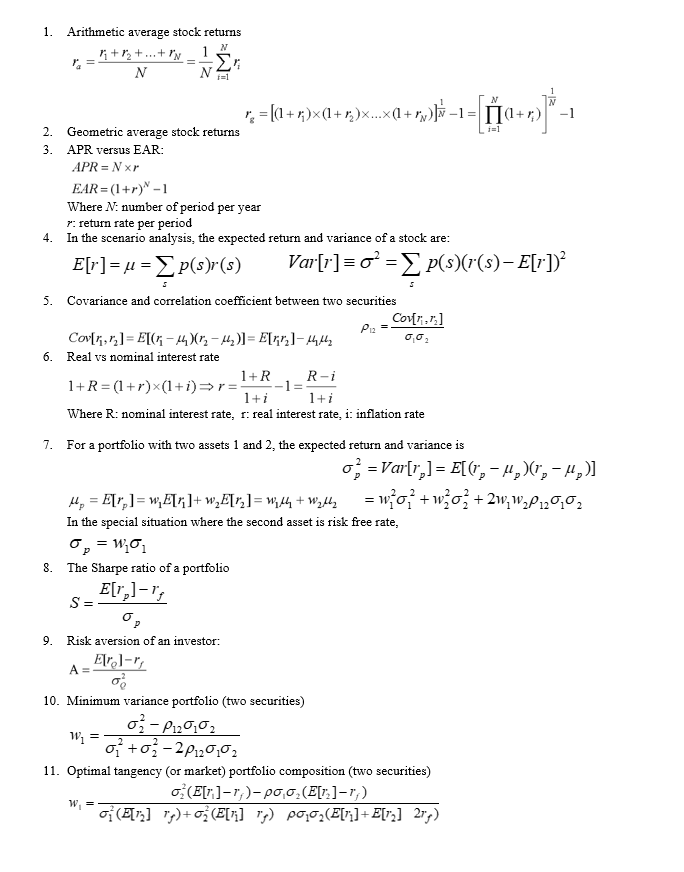
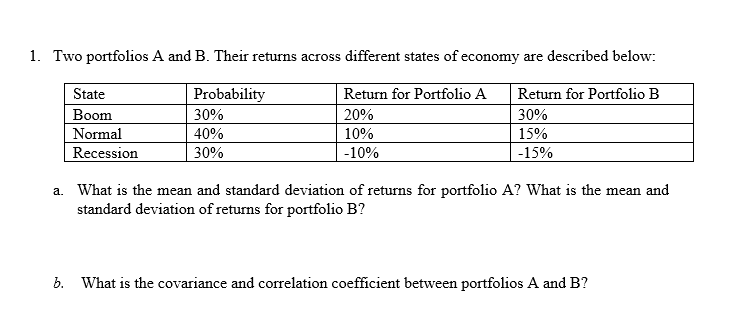
1. Two portfolios A and B. Their returns across different states of economy are described below: State | Boom Normal Recession Probability 30% 40% 30% Return for Portfolio A 20% 10% -10% Return for Portfolio B 30% 15% -15% a. What is the mean and standard deviation of returns for portfolio A? What is the mean and standard deviation of returns for portfolio B? b. What is the covariance and correlation coefficient between portfolios A and B? 1. Arithmetic average stock returns .-= (+r)x(1+r)x.X(1+r)] 1 = 19+r)*-1 2. Geometric average stock returns 3. APR versus EAR: APR = N xr EAR=(1+r)-1 Where N number of period per year r: return rate per period 4. In the scenario analysis, the expected return and variance of a stock are: E[r]=u= p(sr(s) Var[r]=o= ps(r(s)- E[r])? 5. Covariance and correlation coefficient between two securities - Covtri:] Pi Covl 1,r]=E[(-44)(1,-1)= E[Gr.-44. 6. Real vs nominal interest rate 1+R , R-i 1+R=(1+r)*(1+i)=r=1+ 1+i Where R: nominal interest rate, r: real interest rate, i: inflation rate 7. For a portfolio with two assets 1 and 2, the expected return and variance is 0; = Var[r,] = E[(", -,)(r, -4,)] 4 = Er]= w[/]+w,E[r]=W,44 + W, = wo+w202 + 2w,w.100, In the special situation where the second asset is risk free rate, = w01 8. The Sharpe ratio of a portfolio E[r]-17 S 0 9. Risk aversion of an investor: A Elrol-r; 10. Minimum variance portfolio (two securities) 03-P120,02 W +03-28120,02 11. Optimal tangency (or market) portfolio composition (two securities) (E[r]1,)-0,0,(E[7]-7) w,= To (E[r] "p)+c] (E[vi] "p) 2007(E[ri]+E[ra] 20's)
Step by Step Solution
There are 3 Steps involved in it

Get step-by-step solutions from verified subject matter experts