Question: Please answer the following questions using these data: [1]: Develop a plot showing the kilograms of masks imported each month from China and Vietnam (aggregate
Please answer the following questions using these data:
[1]: Develop a plot showing the kilograms of masks imported each month from China and Vietnam (aggregate across these two exporters) by water and air. Devise a second plot that shows the percentage of masks that were imported by airfreight. What patterns do you observe, and speculate why these patterns exist?
[2]: Develop three charts showing the import districts through which masks arrived from China and Vietnam (aggregate across these two exporters) for the second quarter (April - June) of 2019, the second quarter of 2020, and the second quarter of 2021. Show imports based on both water and air freight and include in the charts the top 10 import districts by total weight of imports (Vessel SWT + Air SWT) for the quarter in question. How have the patterns evolved over time?
[3]: There has been substantial interest in understanding the evolution of transportation costs for importing items such as masks. Focusing separately on the import districts of Los Angeles, CA and New York, NY, first develop a plot showing the insurance and freight cost per metric ton (kilograms divided by 1000) of total imports through these two locations (i.e., do not aggregate across the districts). Focus only on imports from China to rule out country-specific factors. What pattern do you observe in the insurance and freight costs per metric ton?
[4]: A second measure often used by economists to represent freight costs is what is termed ad valorem insurance & freight costs, which is calculated as insurance and freight costs divided by the customs import value. Repeat the analysis done for #3 using ad valorem insurance and freight costs (note, use Column F's statistic for customs import value in the denominator). What pattern do you observe? How does this differ from what was observed in #3?
[5]: Devise a data-driven explanation that can reconcile the different conclusions reached in #3 and #5.
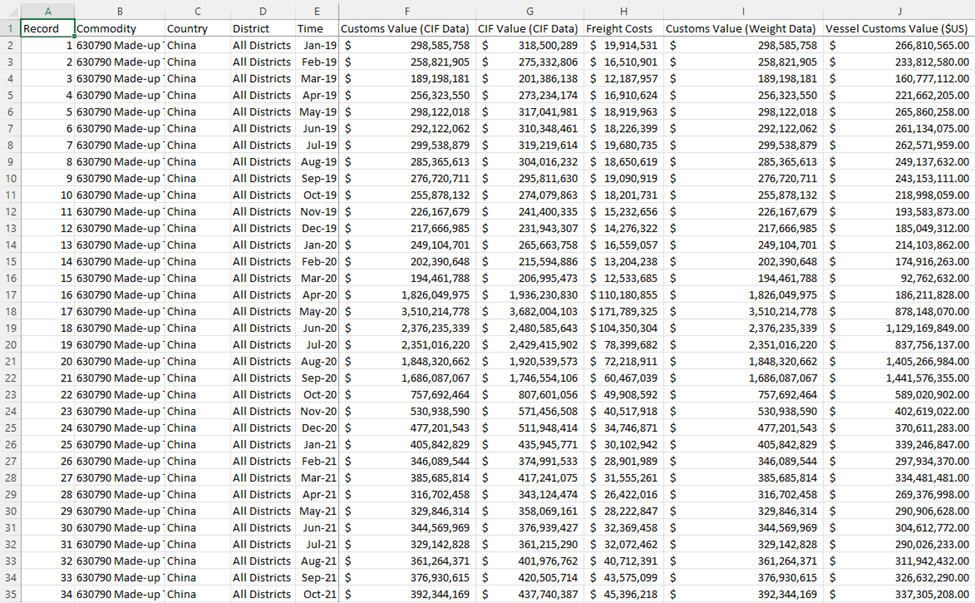
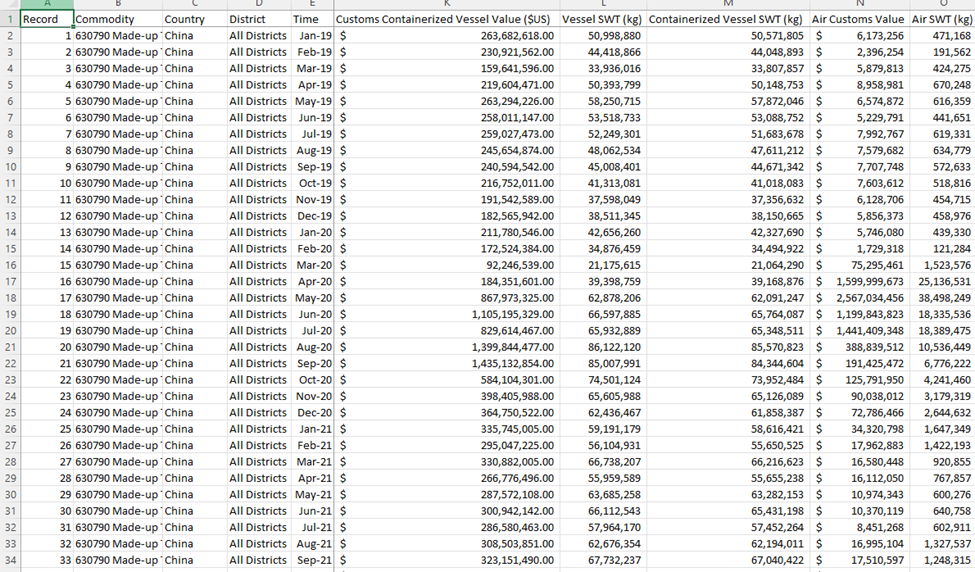
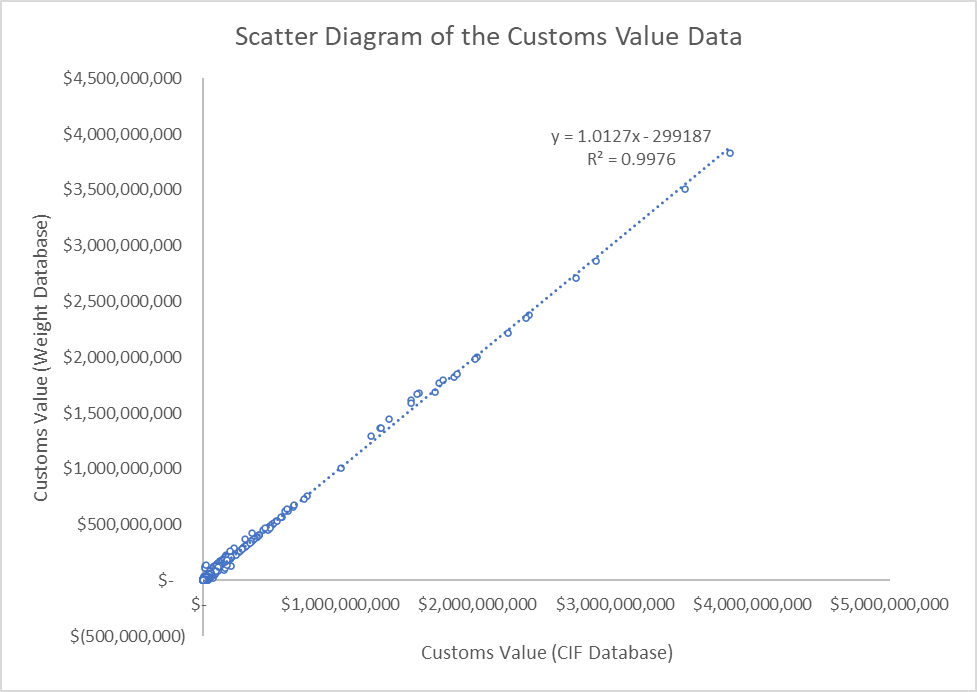
A B C D E F G H Record Commodity Country District Time Customs Value (CIF Data) CIF Value (CIF Data) Freight Costs Customs Value (Weight Data) Vessel Customs Value ($US) IN 1 630790 Made-up " China All Districts Jan-19 $ 298,585,758 $ 318,500,289 $ 19,914,531 $ 298,585,758 $ 266,810,565.00 2 630790 Made-up China All Districts Feb-19 $ 258,821,905 $ 275,332,806 $ 16,510,901 258,821,905 233,812,580.00 3 630790 Made-up China All Districts Mar-19 $ 189,198,181 201,386,138 $ 12,187,957 189,198,181 160,777,112.00 4 630790 Made-up China All Districts Apr-19 $ 256,323,550 273,234,174 $ 16,910,624 $ 256,323,550 221,662,205.00 5 630790 Made-up China All Districts May-19 $ 298,122,018 317,041,981 $ 18,919,963 298,122,018 265,860,258.00 6 630790 Made-up China All Districts Jun-19 $ 292,122,062 310,348,461 $ 18,226,399 292,122,062 261,134,075.00 7 630790 Made-up China All Districts Jul-19 $ 299,538,879 $ 319,219,614 $ 19,680,735 299,538,879 $ 262,571,959.00 8 630790 Made-up China All Districts Aug-19 $ 285,365,613 304,016,232 $ 18,650,619 285,365,613 249,137,632.00 10 9 630790 Made-up " China All Districts Sep-19 $ 276,720,711 295,811,630 $ 19,090,919 $ 276,720,711 243,153,111.00 11 10 630790 Made-up China All Districts Oct-19 $ 255,878,132 274,079,863 $ 18,201,731 255,878,132 $ 218,998,059.00 in in 12 11 630790 Made-up China All Districts Nov-19 $ 226,167,679 241,400,335 $ 15,232,656 226,167,679 193,583,873.00 13 12 630790 Made-up China All Districts Dec-19 $ 217,666,985 231,943,307 $ 14,276,322 $ 217,666,985 185,049,312.00 14 13 630790 Made-up China All Districts Jan-20 $ 249,104,701 265,663,758 $ 16,559,057 249,104,701 214,103,862.00 15 14 630790 Made-up " China All Districts Feb-20 $ 202,390,648 215,594,886 $ 13,204,238 202,390,648 174,916,263.00 16 15 630790 Made-up China All Districts Mar-20 $ 194,461,788 206,995,473 $ 12,533,685 $ 194,461,788 92,762,632.00 17 16 630790 Made-up China All Districts Apr-20 $ 1,826,049,975 1,936,230,830 $ 110,180,855 1,826,049,975 186,211,828.00 18 17 630790 Made-up "China All Districts May-20 $ 3,510,214,778 3,682,004,103 $ 171,789,325 3,510,214,778 878,148,070.00 19 18 630790 Made-up China All Districts Jun-20 $ 2,376,235,339 2,480,585,643 $ 104,350,304 2,376,235,339 1,129,169,849.00 20 19 630790 Made-up China All Districts Jul-20 $ 2,351,016,220 2,429,415,902 $ 78,399,682 2,351,016,220 837,756,137.00 21 20 630790 Made-up China All Districts Aug-20 $ 1,848,320,662 1,920,539,573 $ 72,218,911 1,848,320,662 1,405,266,984.00 22 21 630790 Made-up China All Districts Sep-20 $ 1,686,087,067 1,746,554,106 $ 60,467,039 1,686,087,067 1,441,576,355.00 23 22 630790 Made-up China All Districts Oct-20 $ 757,692,464 807,601,056 $ 49,908,592 757,692,464 589,020,902.00 24 23 630790 Made-up " China All Districts Nov-20 $ 530,938,590 571,456,508 $ 40,517,918 530,938,590 402,619,022.00 25 24 630790 Made-up China All Districts Dec-20 $ 477,201,543 511,948,414 $ 34,746,871 $ 477,201,543 370,611,283.00 26 25 630790 Made-up China All Districts Jan-21 $ 405,842,829 435,945,771 $ 30,102,942 405,842,829 339,246,847.00 27 26 630790 Made-up China All Districts Feb-21 $ in in is 346,089,544 374,991,533 $ 28,901,989 346,089,544 297,934,370.00 28 27 630790 Made-up China All Districts Mar-21 $ 385,685,814 417,241,075 $ 31,555,261 385,685,814 334,481,481.00 29 28 630790 Made-up China All Districts Apr-21 $ 316,702,458 343,124,474 $ 26,422,016 $ 316,702,458 269,376,998.00 30 29 630790 Made-up China All Districts May-21 $ 329,846,314 358,069,161 $ 28,222,847 $ 329,846,314 290,906,628.00 31 30 630790 Made-up China All Districts Jun-21 $ 344,569,969 376,939,427 $ 32,369,458 $ 344,569,969 304,612,772.00 32 31 630790 Made-up " China All Districts Jul-21 $ 329,142,828 361,215,290 $ 32,072,462 329,142,828 290,026,233.00 33 32 630790 Made-up China All Districts Aug-21 $ 361,264,371 401,976,762 $ 40,712,391 $ 361,264,371 311,942,432.00 34 33 630790 Made-up China All Districts Sep-21 $ 376,930,615 $ 420,505,714 $ 43,575,099 $ 376,930,615 S 326,632,290.00 35 34 630790 Made-up "China All Districts Oct-21 $ 392,344,169 $ 437,740,387 $ 45,396,218 $ 392,344,169 S 337,305,208.00Record Commodity Country District Time Customs Containerized Vessel Value ($US) Vessel SWT (kg) Containerized Vessel SWT (kg) Air Customs Value Air SWT (kg) 1 630790 Made-up China All Districts Jan-19 $ 263,682,618.00 50,998,880 50,571,805 $ 6,173,256 471,168 2 630790 Made-up China All Districts Feb-19 $ 230,921,562.00 44,418,866 44,048,893 $ 2,396,254 191,562 3 630790 Made-up " China All Districts Mar-19 $ 159,641,596.00 33,936,016 33,807,857 $ 5,879,813 424,275 4 630790 Made-up China All Districts Apr-19 $ 219,604,471.00 50,393,799 50,148,753 $ 8,958,981 670,248 5 630790 Made-up ' China All Districts May-19 $ 263,294,226.00 58,250,715 57,872,046 $ 6,574,872 616,359 6 630790 Made-up China All Districts Jun-19 $ 258,011,147.00 53,518,733 53,088,752 5,229,791 441,651 7 630790 Made-up China All Districts Jul-19 $ 259,027,473.00 52,249,301 51,683,678 $ 7,992,767 619,331 8 630790 Made-up " China All Districts Aug-19 $ 245,654,874.00 48,062,534 47,611,212 7,579,682 634,779 10 9 630790 Made-up " China All Districts Sep-19 $ 240,594,542.00 45,008,401 44,671,342 $ 7,707,748 572,633 10 630790 Made-up China All Districts Oct-19 $ 216,752,011.00 41,313,081 41,018,083 $ 7,603,612 518,816 12 11 630790 Made-up " China All Districts Nov-19 $ 191,542,589.00 37,598,049 37,356,632 6,128,706 454,715 13 12 630790 Made-up China All Districts Dec-19 $ 182,565,942.00 38,511,345 38,150,665 5,856,373 458,976 14 13 630790 Made-up " China All Districts Jan-20 $ 211,780,546.00 42,656,260 42,327,690 $ 5,746,080 439,330 15 14 630790 Made-up China All Districts Feb-20 $ 172,524,384.00 34,876,459 34,494,922 1,729,318 121,284 16 15 630790 Made-up China All Districts Mar-20 $ 92,246,539.00 21,175,615 21,064,290 $ 75,295,461 1,523,576 17 16 630790 Made-up " China All Districts Apr-20 $ 184,351,601.00 39,398,759 39,168,876 $ 1,599,999,673 25,136,531 18 17 630790 Made-up China All Districts May-20 $ 867,973,325.00 62,878,206 62,091,247 $ 2,567,034,456 38,498,249 19 18 630790 Made-up ' China All Districts Jun-20 $ 1,105,195,329.00 66,597,885 65,764,087 $ 1,199,843,823 18,335,536 20 19 630790 Made-up China All Districts Jul-20 $ 829,614,467.00 65,932,889 65,348,511 $ 1,441,409,348 18,389,475 21 20 630790 Made-up China All Districts Aug-20 $ 1,399,844,477.00 86,122,120 85,570,823 $ 388,839,512 10,536,449 22 21 630790 Made-up China All Districts Sep-20 $ 1,435,132,854.00 85,007,991 84,344,604 $ 191,425,472 6,776,222 23 22 630790 Made-up China All Districts Oct-20 $ 584,104,301.00 74,501,124 73,952,484 125,791,950 4,241,460 24 23 630790 Made-up China All Districts Nov-20 $ 398,405,988.00 65,605,988 65,126,089 $ 90,038,012 3,179,319 25 24 630790 Made-up China All Districts Dec-20 $ 364,750,522.00 62,436,467 61,858,387 72,786,466 2,644,632 26 25 630790 Made-up China All Districts Jan-21 $ 335,745,005.00 59,191,179 58,616,421 $ 34,320,798 1,647,349 27 26 630790 Made-up " China All Districts Feb-21 $ 295,047,225.00 56,104,931 55,650,525 $ 17,962,883 1,422,193 28 27 630790 Made-up China All Districts Mar-21 $ 330,882,005.00 66,738,207 66,216,623 16,580,448 920,855 29 28 630790 Made-up ' China All Districts Apr-21 $ 266,776,496.00 55,959,589 55,655,238 $ 16,112,050 767,857 30 29 630790 Made-up " China All Districts May-21 $ 287,572,108.00 63,685,258 63,282,153 $ 10,974,343 600,276 31 30 630790 Made-up China All Districts Jun-21 $ 300,942,142.00 66,112,543 65,431,198 10,370,119 640,758 32 31 630790 Made-up " China All Districts Jul-21 $ 286,580,463.00 57,964,170 57,452,264 $ 8,451,268 602,911 33 32 630790 Made-up China All Districts Aug-21 $ 308,503,851.00 62,676,354 62,194,011 $ 16,995,104 1,327,537 34 33 630790 Made-up China All Districts Sep-21 $ 323,151,490.00 67,732,237 67,040,422 $ 17,510,597 1,248,315Scatter Diagram of the Customs Value Data $4,500,000,000 $4,000,000,000 y = 1.0127x - 299187 R2 = 0.9976 $3,500,000,000 $3,000,000,000 $2,500,000,000 Customs Value (Weight Database) $2,000,000,000 $1,500,000,000 $1,000,000,000 $500,000,000 S- S $1,000,000,000 $2,000,000,000 $3,000,000,000 $4,000,000,000 $5,000,000,000 $(500,000,000) Customs Value (CIF Database)
Step by Step Solution
There are 3 Steps involved in it
1 Expert Approved Answer
Step: 1 Unlock
Question Has Been Solved by an Expert!
Get step-by-step solutions from verified subject matter experts
Step: 2 Unlock
Step: 3 Unlock
Students Have Also Explored These Related General Management Questions!