

Question: Please answer the following the question using STAT: 4. Hypotheses for a statistical test are given, followed by several possible confidence intervals for different samples.
Please answer the following the question using STAT:
4.
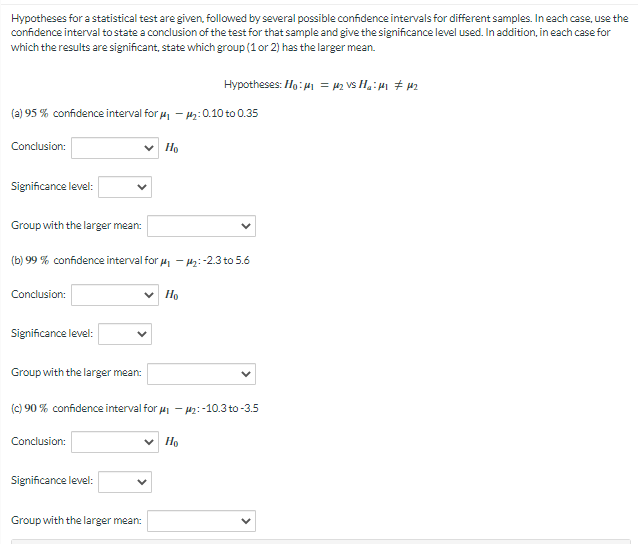
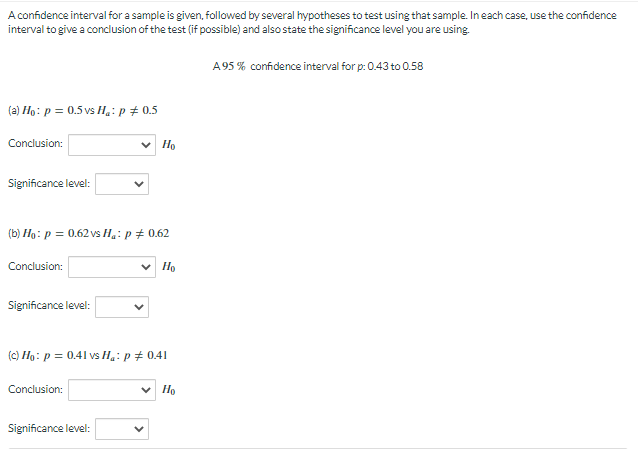
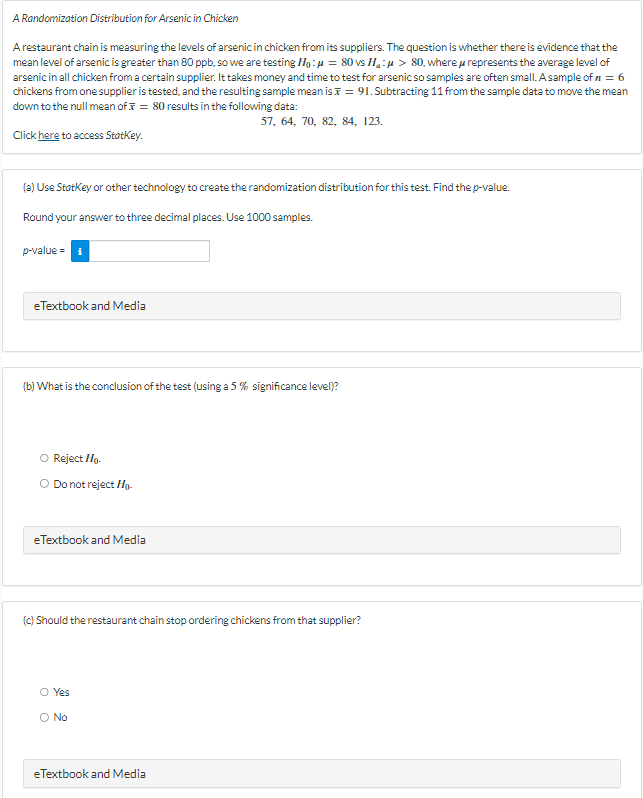
Hypotheses for a statistical test are given, followed by several possible confidence intervals for different samples. In each case, use the confidence interval to state a conclusion of the test for that sample and give the significance level used. In addition, in each case for which the results are significant, state which group (1 or 2) has the larger mean. Hypotheses: Ho: #1 = #2 VS Ha: # # #2 (a) 95 % confidence interval for , - #2: 0.10 to 0.35 Conclusion: v Ho Significance level: Group with the larger mean: (b) 99 % confidence interval for # - #2: -2.3 to 5.6 Conclusion: Ho Significance level: Group with the larger mean: (c) 90 % confidence interval for #| - #2: -10.3 to-3.5 Conclusion: v Ho Significance level: Group with the larger mean:A confidence interval for a sample is given, followed by several hypotheses to test using that sample. In each case, use the confidence interval to give a conclusion of the test (if possible) and also state the significance level you are using. A95 % confidence interval for p: 0.43 to 0.58 (a) Ho: p = 0.5vs Ha: p # 0.5 Conclusion: Ho Significance level: v (b) Ho: p = 0.62 vs Ha : p # 0.62 Conclusion: Ho Significance level: (c) Ho : p = 0.41 vs Ha: p # 0.41 Conclusion: Ho Significance level:A Randomization Distribution for Arsenic in Chicken A restaurant chain is measuring the levels of arsenic in chicken from its suppliers. The question is whether there is evidence that the mean level of arsenic is greater than 80 ppb. so we are testing /o: / = 80 vs /_: > > 80, where a represents the average level of arsenic in all chicken from a certain supplier. It takes money and time to test for arsenic so samples are often small. A sample of n = 6 chickens from one supplier is tested, and the resulting sample mean is * = 91. Subtracting 11 from the sample date to move the mean down to the null mean of * = 80 results in the following data: 57, 64, 70, 82, 84, 123. Click here to access StotKey. (e) Use Starkey or other technology to create the randomization distribution for this test. Find the p-value. Round your answer to three decimal places. Use 1000 samples. p-value = 1 eTextbook and Media (b) What is the conclusion of the test (using a 5 % significance level)? O Reject Ho- O Do not reject Ho- eTextbook and Media (c) Should the restaurant chain stop ordering chickens from that supplier? O Yes O No eTextbook and Media
Step by Step Solution
There are 3 Steps involved in it

Get step-by-step solutions from verified subject matter experts