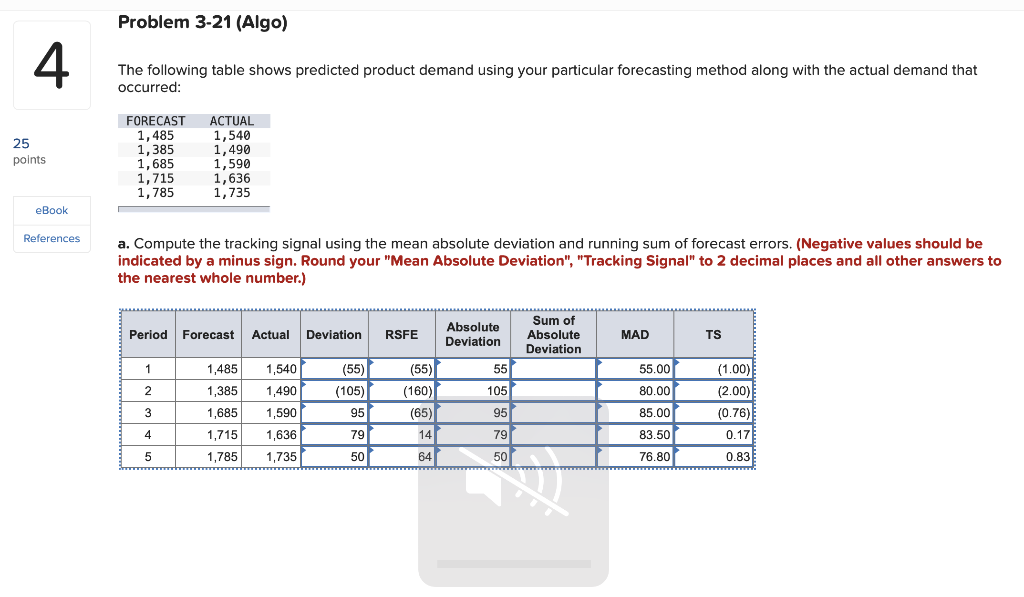
Question: Please answer the full question, I think the answers inserted are wrong. Problem 3-21 (Algo) 4 The following table shows predicted product demand using your

Please answer the full question, I think thePlease answer the full question, I think the answers inserted are wrong.

Problem 3-21 (Algo) 4 The following table shows predicted product demand using your particular forecasting method along with the actual demand that occurred: 25 points FORECAST 1,485 1,385 1,685 1,715 1,785 ACTUAL 1,540 1,490 1,590 1,636 1,735 eBook References a. Compute the tracking signal using the mean absolute deviation and running sum of forecast errors. (Negative values should be indicated by a minus sign. Round your "Mean Absolute Deviation", "Tracking Signal" to 2 decimal places and other answers to the nearest whole number.) Period Forecast Actual Deviation RSFE Absolute Deviation Sum of Absolute Deviation MAD TS 1 1,540 (55) (105) 55.00 80.00 2 3 1,485 1,385 1,685 1,715 1,785 1,490 1,590 1,636 1,735 (55)| (160) (65) | 14 64 85.00 55 1051 95 79 50 95 79 50 (1.00) (2.00) (0.76) 0.17 0.83 4 83.50 76.80 5

Step by Step Solution

There are 3 Steps involved in it

1 Expert Approved Answer
Step: 1 Unlock blur-text-image
Question Has Been Solved by an Expert!

Get step-by-step solutions from verified subject matter experts

Step: 2 Unlock
Step: 3 Unlock

Students Have Also Explored These Related General Management Questions!