

Question: please answer the full question. Industry Analysis (SLO2): Demonstrate the ability to seek, handle and interpret key economic and behavioral data which underpin marketing practice.
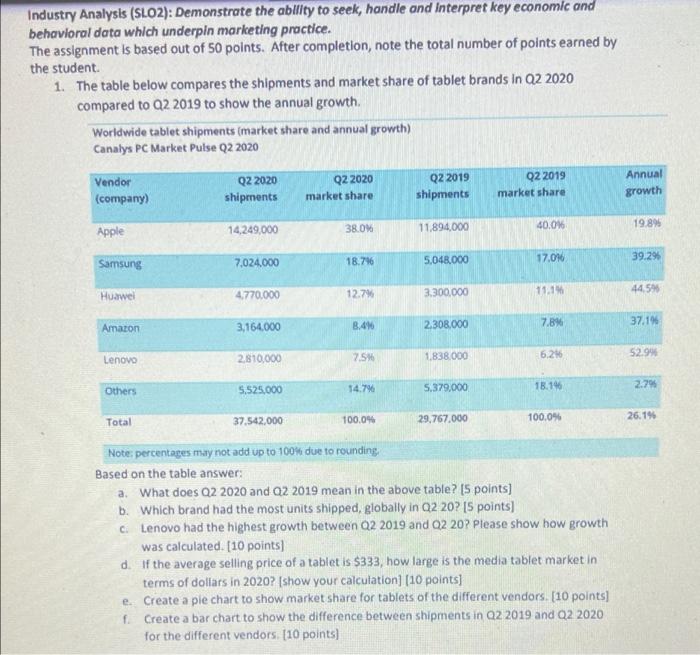
Industry Analysis (SLO2): Demonstrate the ability to seek, handle and interpret key economic and behavioral data which underpin marketing practice. The assignment is based out of 50 points. After completion, note the total number of points earned by the student. 1. The table below compares the shipments and market share of tablet brands in Q2 2020 compared to Q2 2019 to show the annual growth Worldwide tablet shipments (market share and annual growth) Canalys PC Market Pulse Q2 2020 Vendor (company) Q2 2020 shipments Q2 2020 market share Q2 2019 shipments Q2 2019 market share Annual growth Apple 14,249,000 38.0% 11,894,000 19.896 40.0% Samsung 7,024,000 18.7% 5,048.000 17.00 39.29 Huawei 15.1 44.5 4.770.000 12.7% 3.300.000 Amaton 3,164.000 8.4 2.308.000 37.196 7.8% 2.810,000 7.5W 1.838.000 Lenovo 6.24 52.9% Others 5.525.000 2.796 14.79 5.379,000 18.14 Total 37.542.000 100.0% 29,767.000 26.19 100.0% Note; percentages may not add up to 100% due to rounding, Based on the table answer: a. What does 02 2020 and Q2 2019 mean in the above table? [5 points) b. Which brand had the most units shipped, globally in Q2 207 [5 points) ci Lenovo had the highest growth between Q2 2019 and Q2 20? Please show how growth was calculated. [10 points) d. If the average selling price of a tablet is $333, how large is the media tablet market in terms of dollars in 2020? (show your calculation (10 points] e. Create a ple chart to show market share for tablets of the different vendors. [10 points) f Create a bar chart to show the difference between shipments in Q2 2019 and Q2 2020 for the different vendors. [10 points) Industry Analysis (SLO2): Demonstrate the ability to seek, handle and interpret key economic and behavioral data which underpin marketing practice. The assignment is based out of 50 points. After completion, note the total number of points earned by the student. 1. The table below compares the shipments and market share of tablet brands in Q2 2020 compared to Q2 2019 to show the annual growth Worldwide tablet shipments (market share and annual growth) Canalys PC Market Pulse Q2 2020 Vendor (company) Q2 2020 shipments Q2 2020 market share Q2 2019 shipments Q2 2019 market share Annual growth Apple 14,249,000 38.0% 11,894,000 19.896 40.0% Samsung 7,024,000 18.7% 5,048.000 17.00 39.29 Huawei 15.1 44.5 4.770.000 12.7% 3.300.000 Amaton 3,164.000 8.4 2.308.000 37.196 7.8% 2.810,000 7.5W 1.838.000 Lenovo 6.24 52.9% Others 5.525.000 2.796 14.79 5.379,000 18.14 Total 37.542.000 100.0% 29,767.000 26.19 100.0% Note; percentages may not add up to 100% due to rounding, Based on the table answer: a. What does 02 2020 and Q2 2019 mean in the above table? [5 points) b. Which brand had the most units shipped, globally in Q2 207 [5 points) ci Lenovo had the highest growth between Q2 2019 and Q2 20? Please show how growth was calculated. [10 points) d. If the average selling price of a tablet is $333, how large is the media tablet market in terms of dollars in 2020? (show your calculation (10 points] e. Create a ple chart to show market share for tablets of the different vendors. [10 points) f Create a bar chart to show the difference between shipments in Q2 2019 and Q2 2020 for the different vendors. [10 points)
Step by Step Solution
There are 3 Steps involved in it

Get step-by-step solutions from verified subject matter experts