

Question: PLEASE ANSWER THE GRAPH (DWL AND MC social) WITH STEPS !!! The figure below shows supply and demand for planting trees, based on private costs
PLEASE ANSWER THE GRAPH ("DWL" AND MC social) WITH STEPS !!!
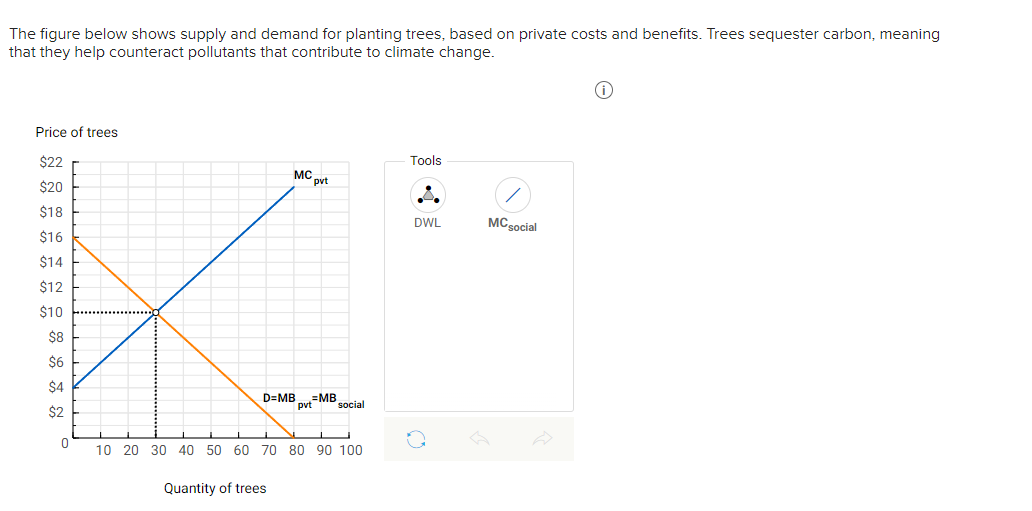
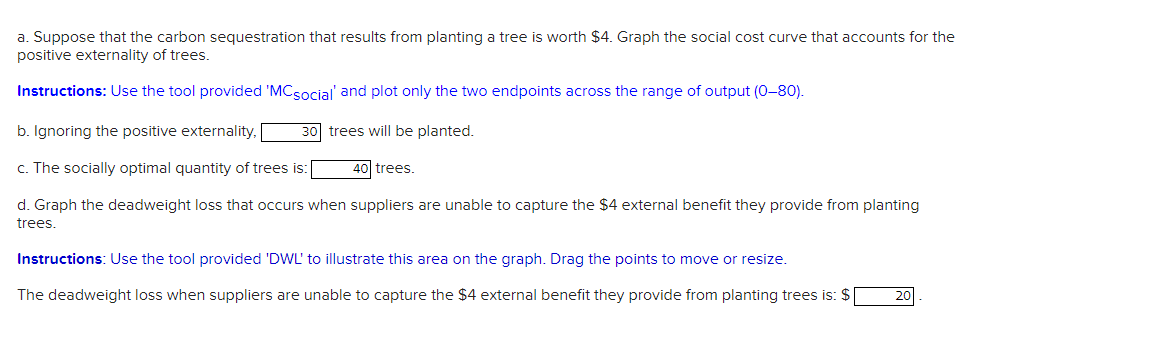
The figure below shows supply and demand for planting trees, based on private costs and benefits. Trees sequester carbon, meaning that they help counteract pollutants that contribute to climate change. a. Suppose that the carbon sequestration that results from planting a tree is worth $4. Graph the social cost curve that accounts for the positive externality of trees. Instructions: Use the tool provided ' MCsocial and plot only the two endpoints across the range of output (0-80). b. Ignoring the positive externality, trees will be planted. c. The socially optimal quantity of trees is: trees. d. Graph the deadweight loss that occurs when suppliers are unable to capture the $4 external benefit they provide from planting trees. Instructions: Use the tool provided 'DWL' to illustrate this area on the graph. Drag the points to move or resize. The deadweight loss when suppliers are unable to capture the $4 external benefit they provide from planting trees is: $
Step by Step Solution
There are 3 Steps involved in it

Get step-by-step solutions from verified subject matter experts