

Question: Please answer the highlighted yellow sheet with how you got the answers. Please don't copy paste from other incorrect answers Mara Jade also analyzes the
Please answer the highlighted yellow sheet with how you got the answers. Please don't copy paste from other incorrect answers
Mara Jade also analyzes the severity from all claims that occurred over a one-year period, based on the following data:
| Range of Loss Amount | Midpoint Dollar Amount of Losses | Number of Losses |
| $1 - $7,999 | 4,000 | 100 |
| $8,000 - $20,000 | 14,000 | 50 |
| Greater than $20,000 | 80,000 | 3 |
E) Fill in the table to find the average severity per claim.
F) Use the information in the table to estimate a probability distribution for the loss severity per claim.
G) Use convolution to find the average loss.
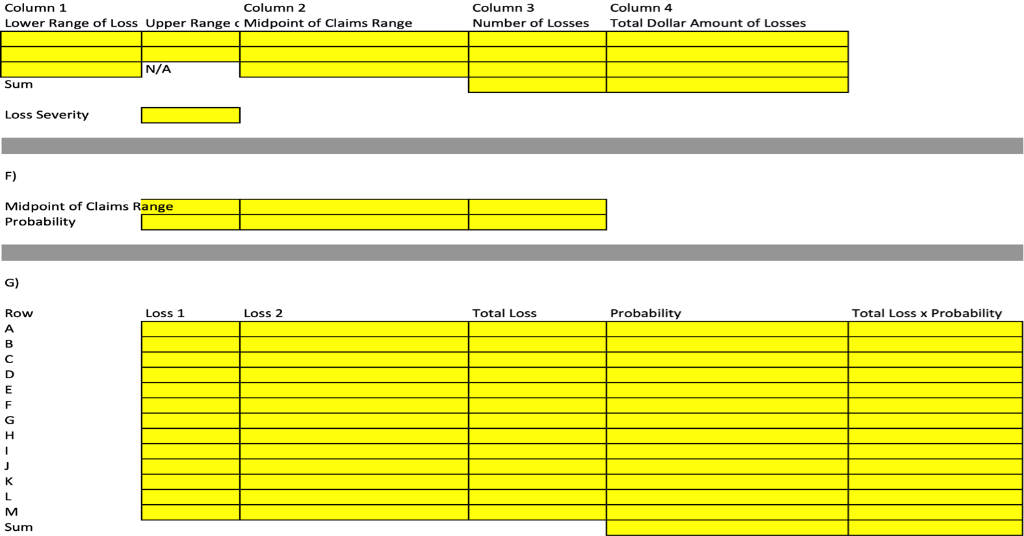
Column 1 Lower Range of Loss Upper Range c Midpoint of Claims Range Column2 Column3 Number of Losses Column4 Total Dollar Amount of Losses N/A Sum Loss Severity F) Midpoint of Claims Range Probability G) Row Loss 1 Loss 2 Total Loss Probability Total Loss x Probability Sum Column 1 Lower Range of Loss Upper Range c Midpoint of Claims Range Column2 Column3 Number of Losses Column4 Total Dollar Amount of Losses N/A Sum Loss Severity F) Midpoint of Claims Range Probability G) Row Loss 1 Loss 2 Total Loss Probability Total Loss x Probability Sum
Step by Step Solution
There are 3 Steps involved in it

Get step-by-step solutions from verified subject matter experts