

Question: please answer the last 2 pictures with the data in the beginning. need for this case: 1. Download the Excel file -Discount_Goods_Big_Store_Financials: 2. Open Tableau
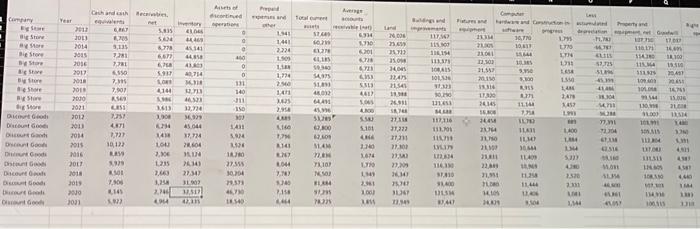
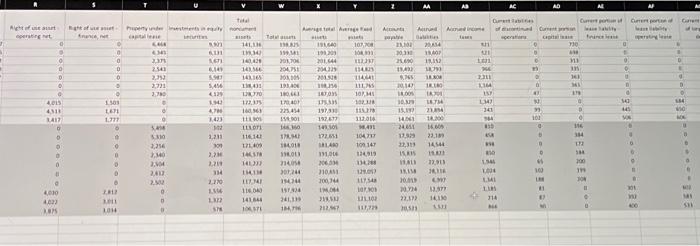
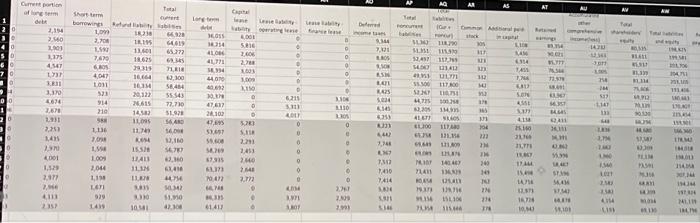
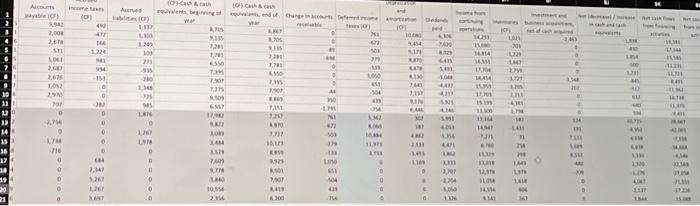
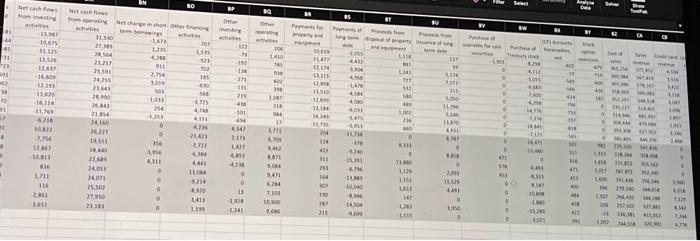
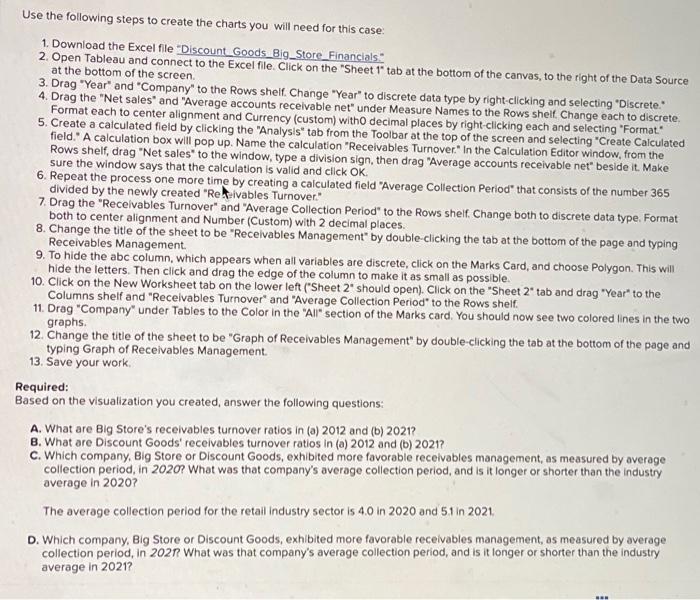
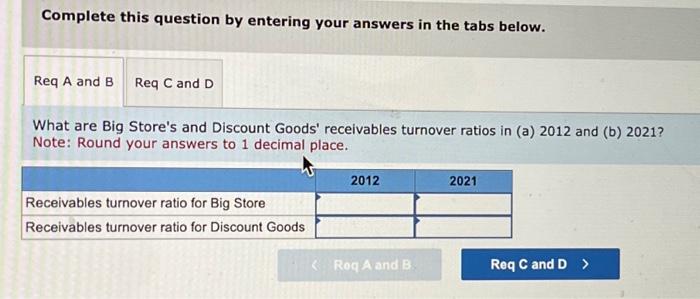
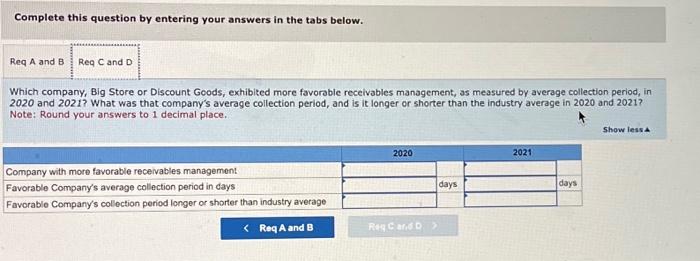
need for this case: 1. Download the Excel file -Discount_Goods_Big_Store_Financials: 2. Open Tableau and connect to the Excel file. Click on the "Sheet 1 " tab at the bottom of the canvas, to the right of the Data Source at the bottom of the screen. 3. Drag "Year" and "Company" to the Rows shelf. Change "Year" to discrete data type by right-clicking and selecting "Discrete." 4. Drag the "Net sales" and "Average accounts recelvable net" under Measure Names to the Rows shelf. Change each to discrete. Format each to center alignment and Currency (custom) witho decimal places by right-clicking each and selecting "Format" 5. Create a calculated field by clicking the "Analysis" tab from the Toolbar at the top of the screen and selecting "Create Calculated field." A calculation box will pop up. Name the calculation "Receivables Turnover." In the Calculation Editor window, from the Rows shelf, drag "Net sales" to the window, type a division sign, then drag "Average accounts receivable net" beside it. Make sure the window says that the calculation is valid and click OK. 6. Repeat the process one more time by creating a calculated field "Average Collection Period" that consists of the number 365 divided by the newly created "Re hivables Turnover." 7. Drag the "Receivables Turnover" and "Average Collection Period" to the Rows shelf. Change both to discrete data type. Format both to center alignment and Number (Custom) with 2 decimal places. 8. Change the title of the sheet to be "Recelvables Management" by double-clicking the tab at the bottom of the page and typing Receivables Management. 9. To hide the abc column, which appears when all variables are discrete, click on the Marks Card, and choose Polygon. This will hide the letters. Then click and drag the edge of the column to make it as small as possible. 10. Click on the New Worksheet tab on the lower left ("Sheet 2 should open). Click on the "Sheet 2 tab and drag "Year" to the Columns shelf and "Receivables Turnover" and "Average Collection Period" to the Rows shelf. 11. Drag "Company" under Tables to the Color in the "All" section of the Marks card. You should now see two colored lines in the two graphs. 12. Change the title of the sheet to be "Graph of Receivables Management" by double-clicking the tab at the bottom of the page and typing Graph of Receivables Management. 13. Save your work. Required: Based on the visualization you created, answer the following questions: A. What are Big Store's receivables turnover ratios in (a) 2012 and (b) 2021 ? B. What are Discount Goods' receivables turnover ratios in (a) 2012 and (b) 2021? C. Which company, Big Store or Discount Goods, exhibited more favorable recelvables management, as measured by average collection period, in 2020? What was that company's average collection period, and is it longer or shorter than the industry average in 2020 ? The average collection period for the retail industry sector is 4.0 in 2020 and 5.1 in 2021. D. Which company, Big Store or Discount Goods, exhibited more favorable recelvables management, as measured by average collection period, in 202R What was that company's average collection period, and is it longer or shorter than the industry average in 2021? Complete this question by entering your answers in the tabs below. What are Big Store's and Discount Goods' receivables turnover ratios in (a) 2012 and (b) 2021? Note: Round your answers to 1 decimal place. Complete this question by entering your answers in the tabs below. Which company, Big Store or Discount Goods, exhibited more favorable recelvables management, as measured by average collection period, in 2020 and 2021 ? What was that company's average collection period, and is it longer or shorter than the industry average in 2020 and 2021 ? Note: Round your answers to 1 decimal place
Step by Step Solution
There are 3 Steps involved in it

Get step-by-step solutions from verified subject matter experts