

Question: Please answer the ones in red. Karane Enterprises, a calendar-year manufacturer based in College Station, Texas, began business in 2020. In the process of setting
Please answer the ones in red.
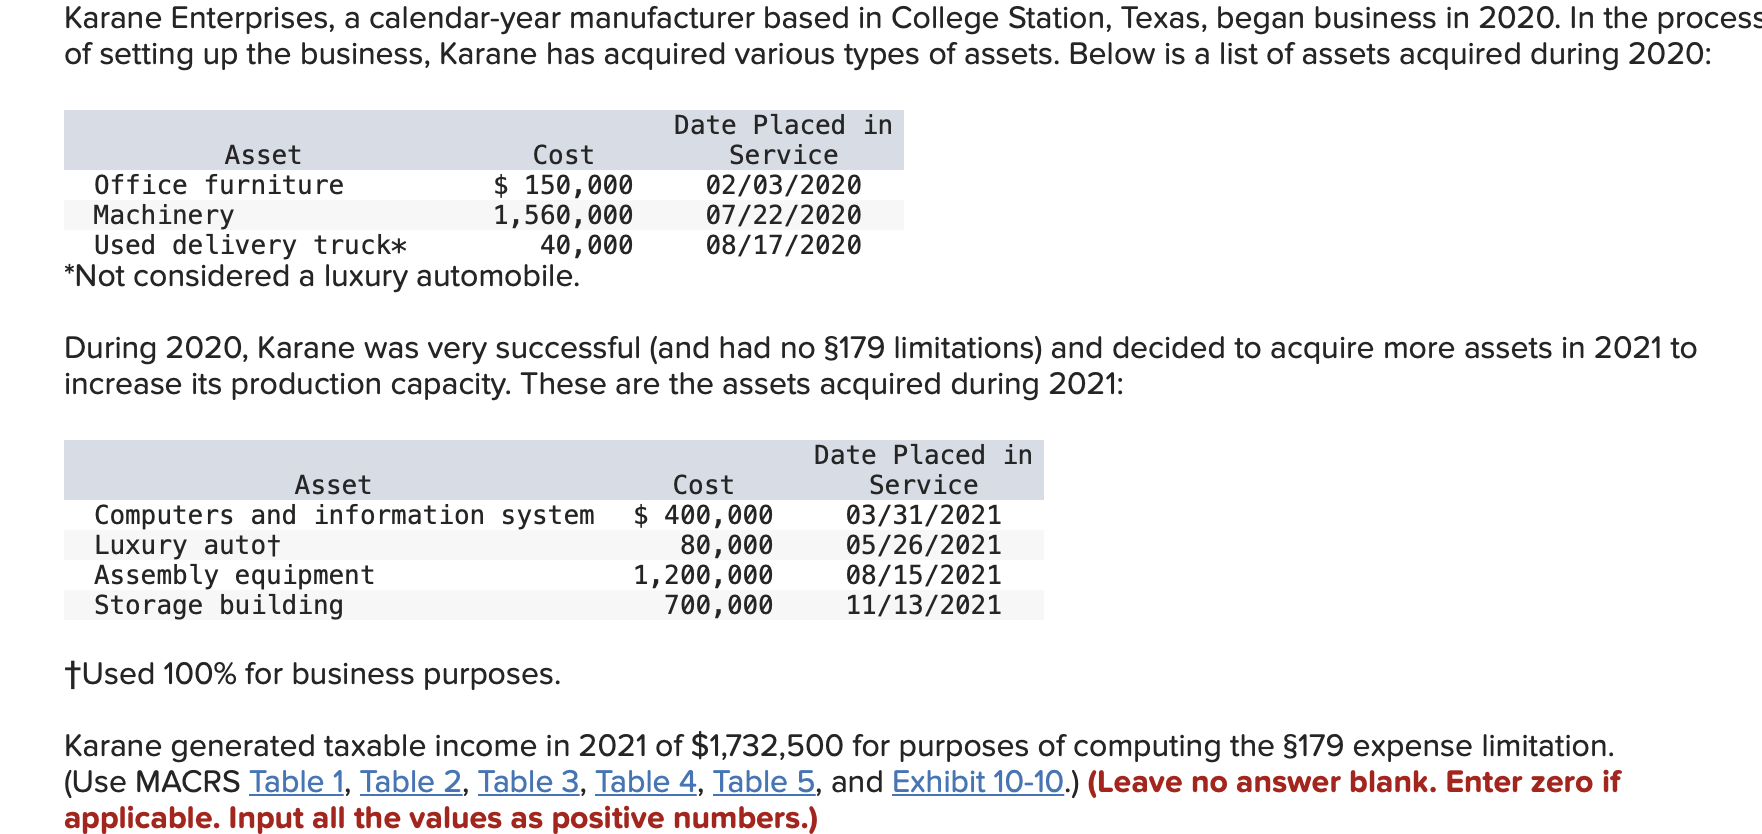
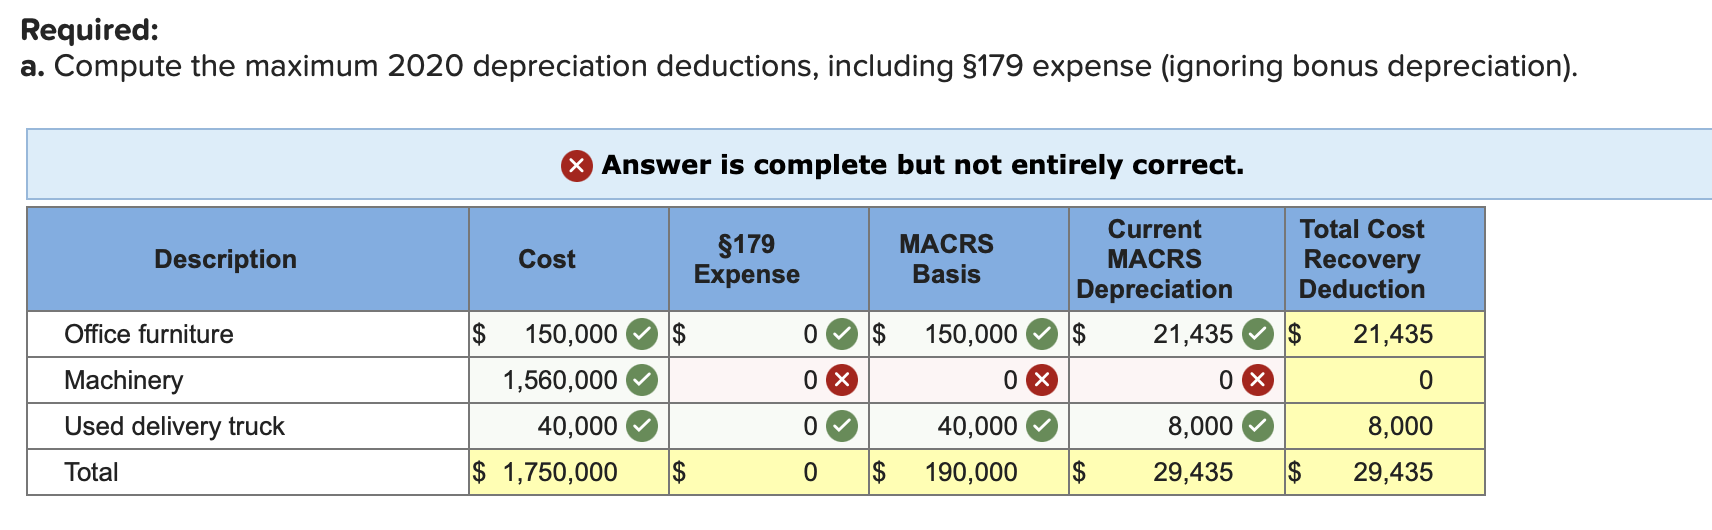
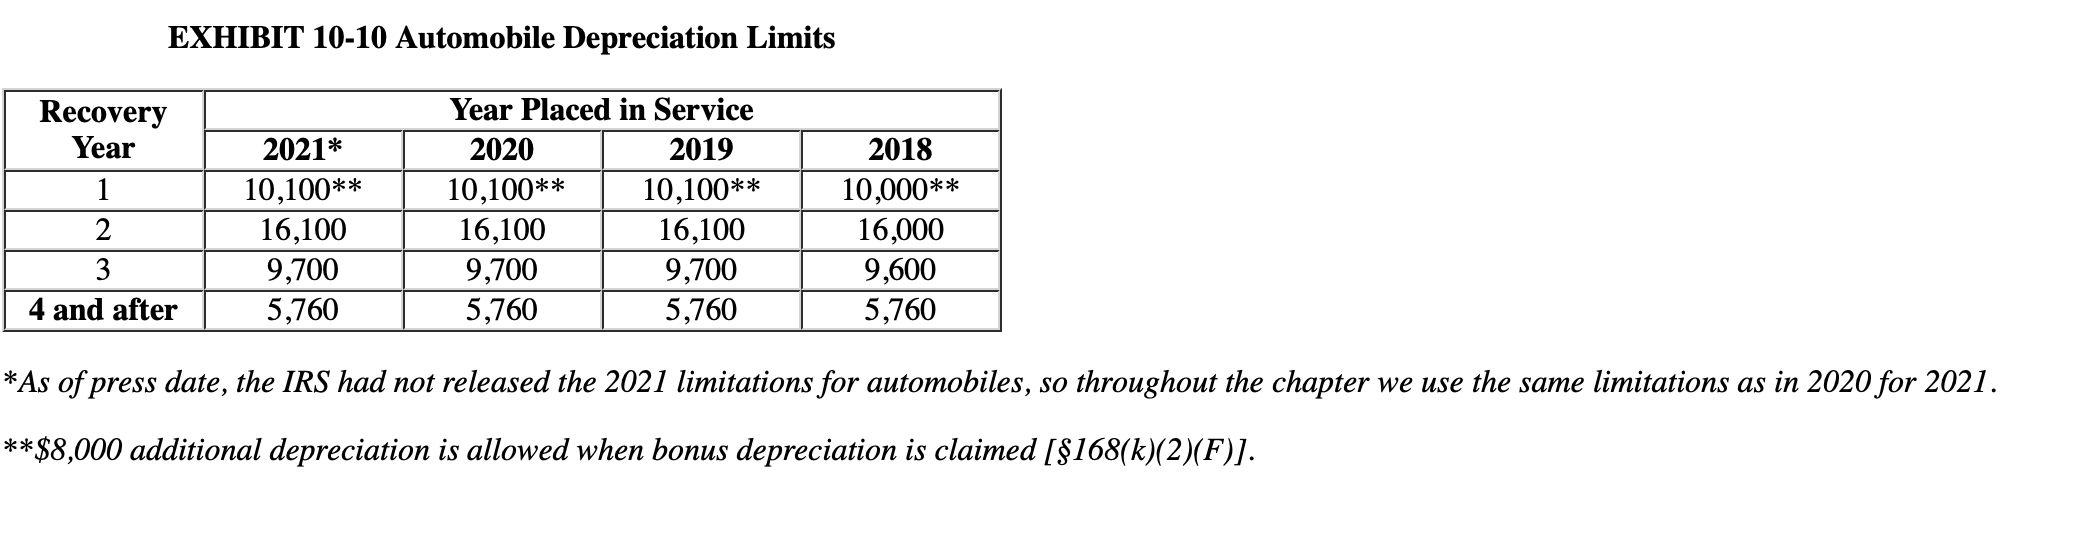
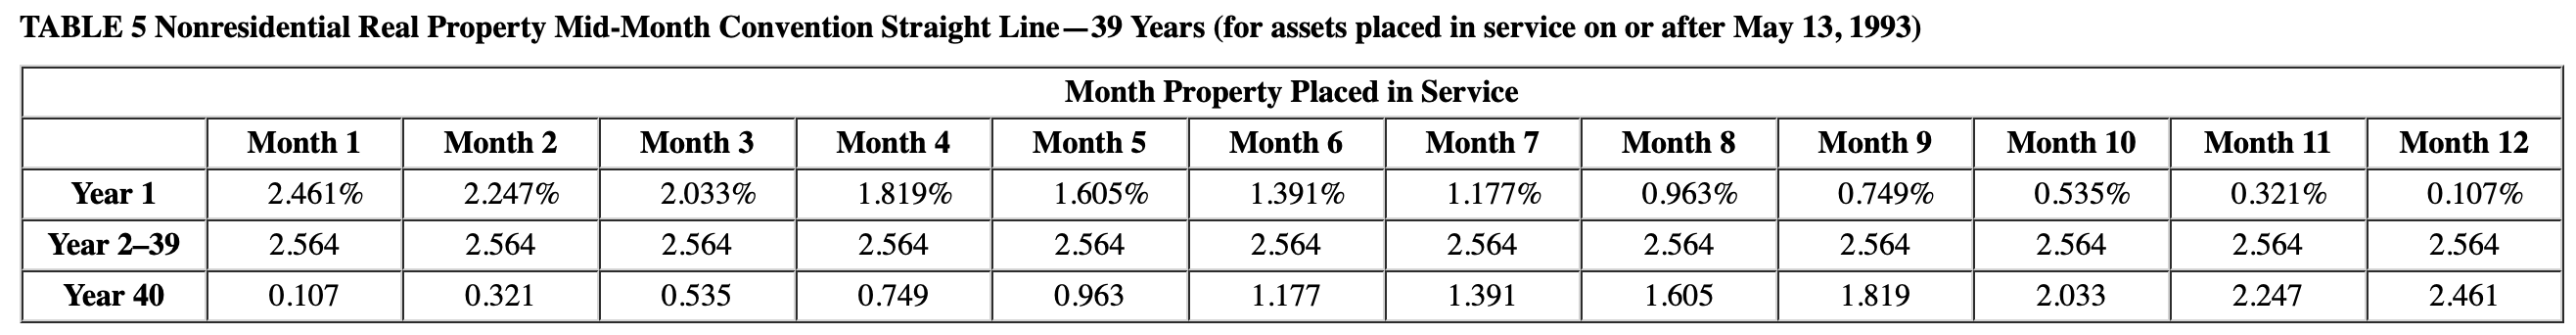
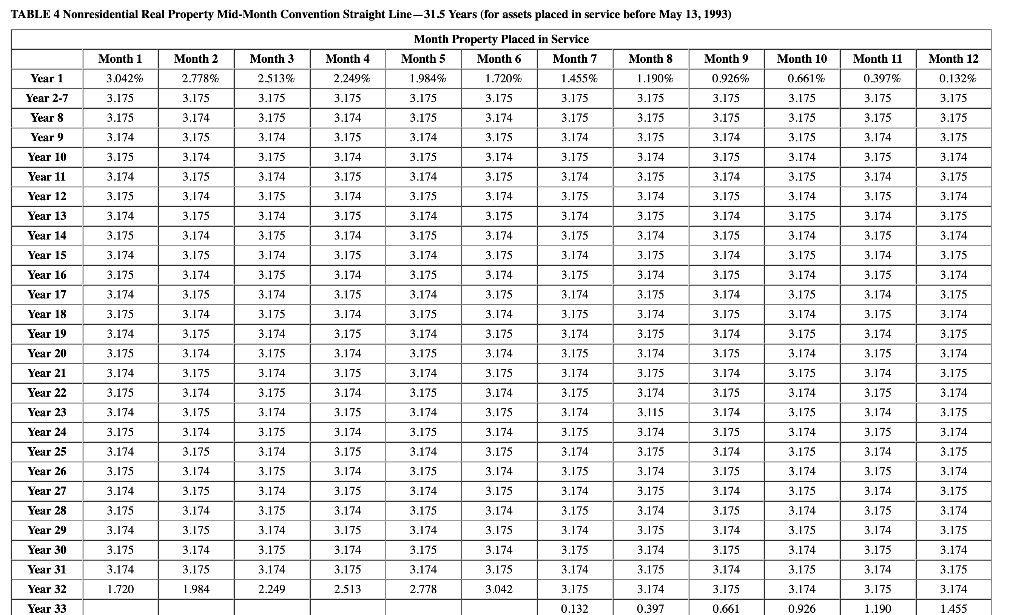
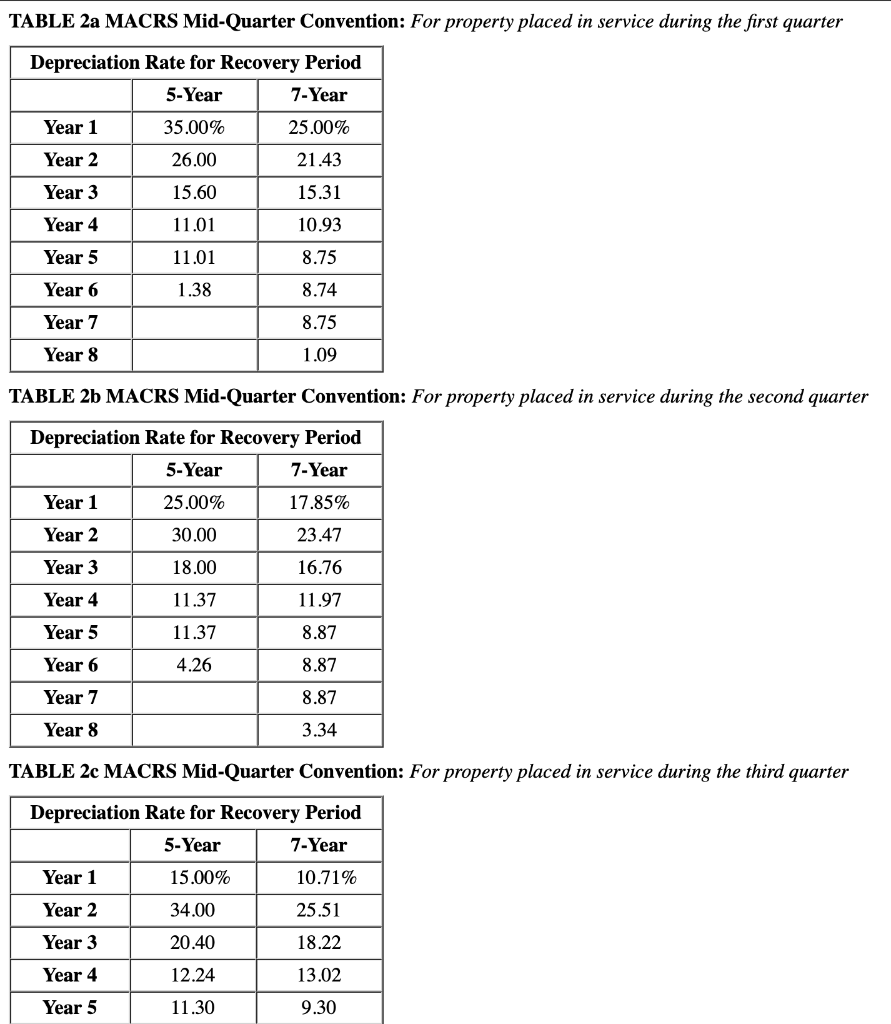
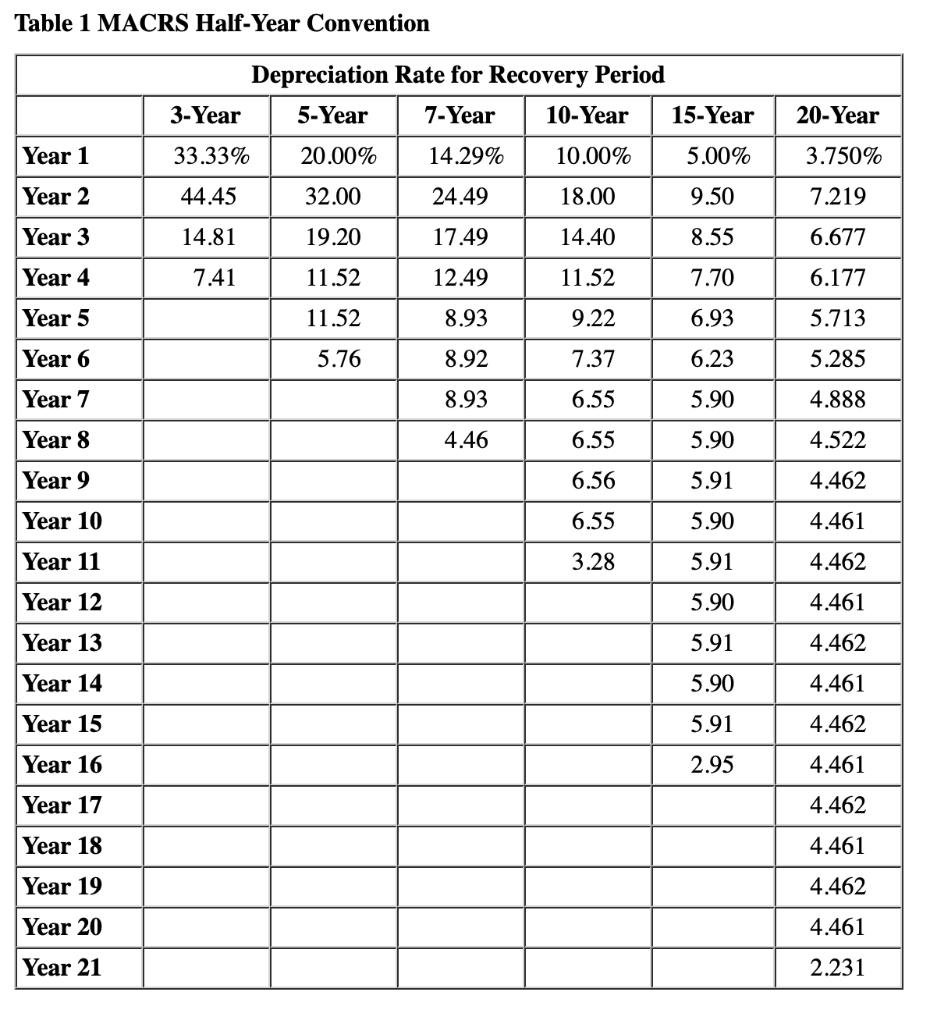
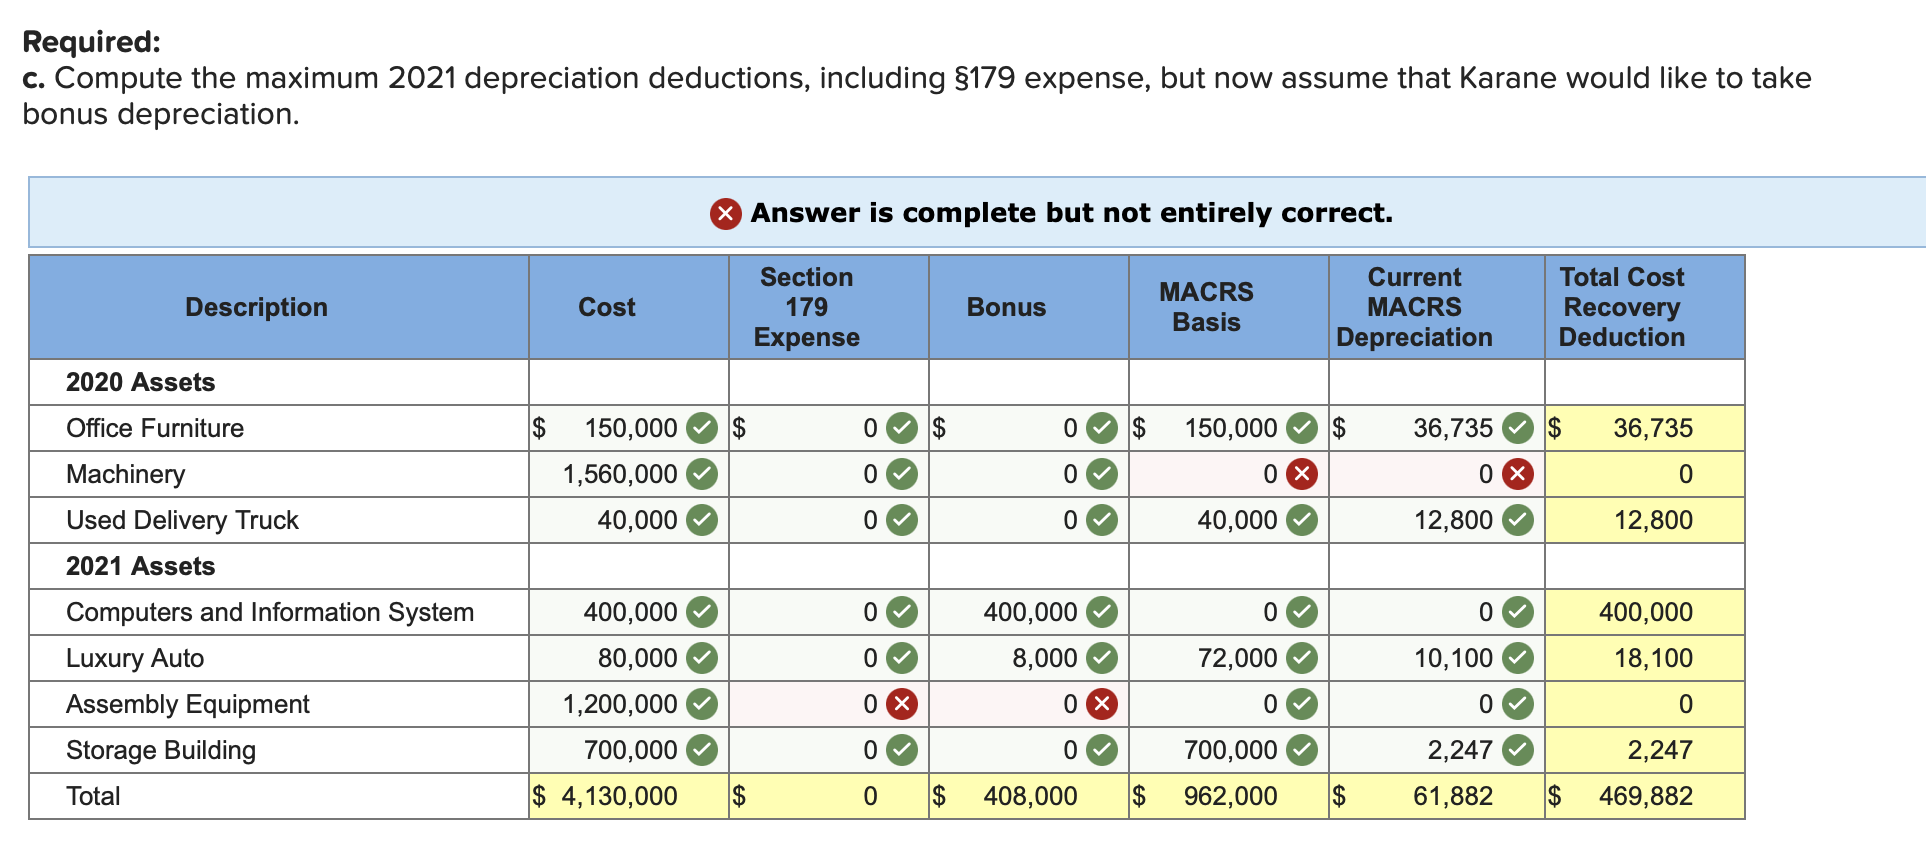
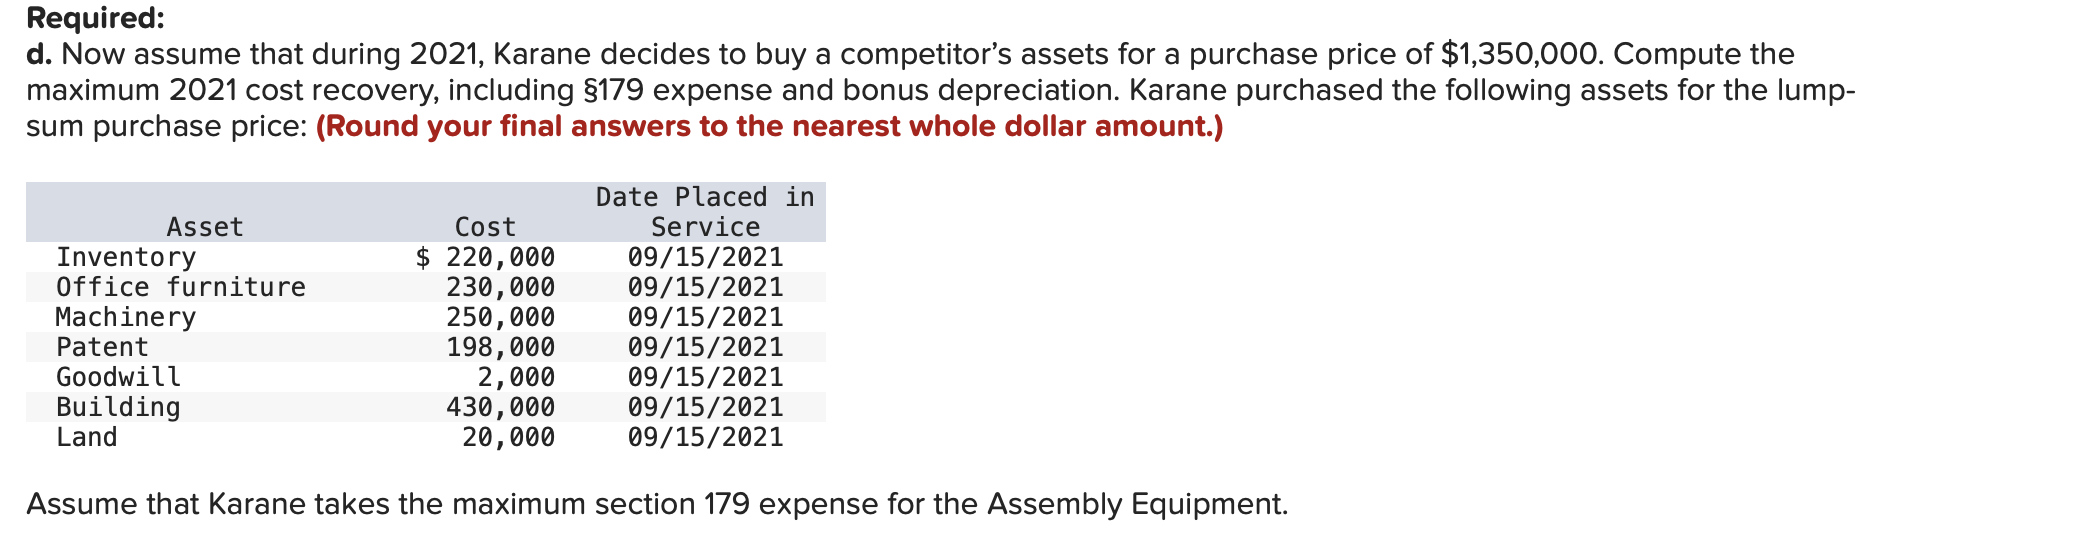
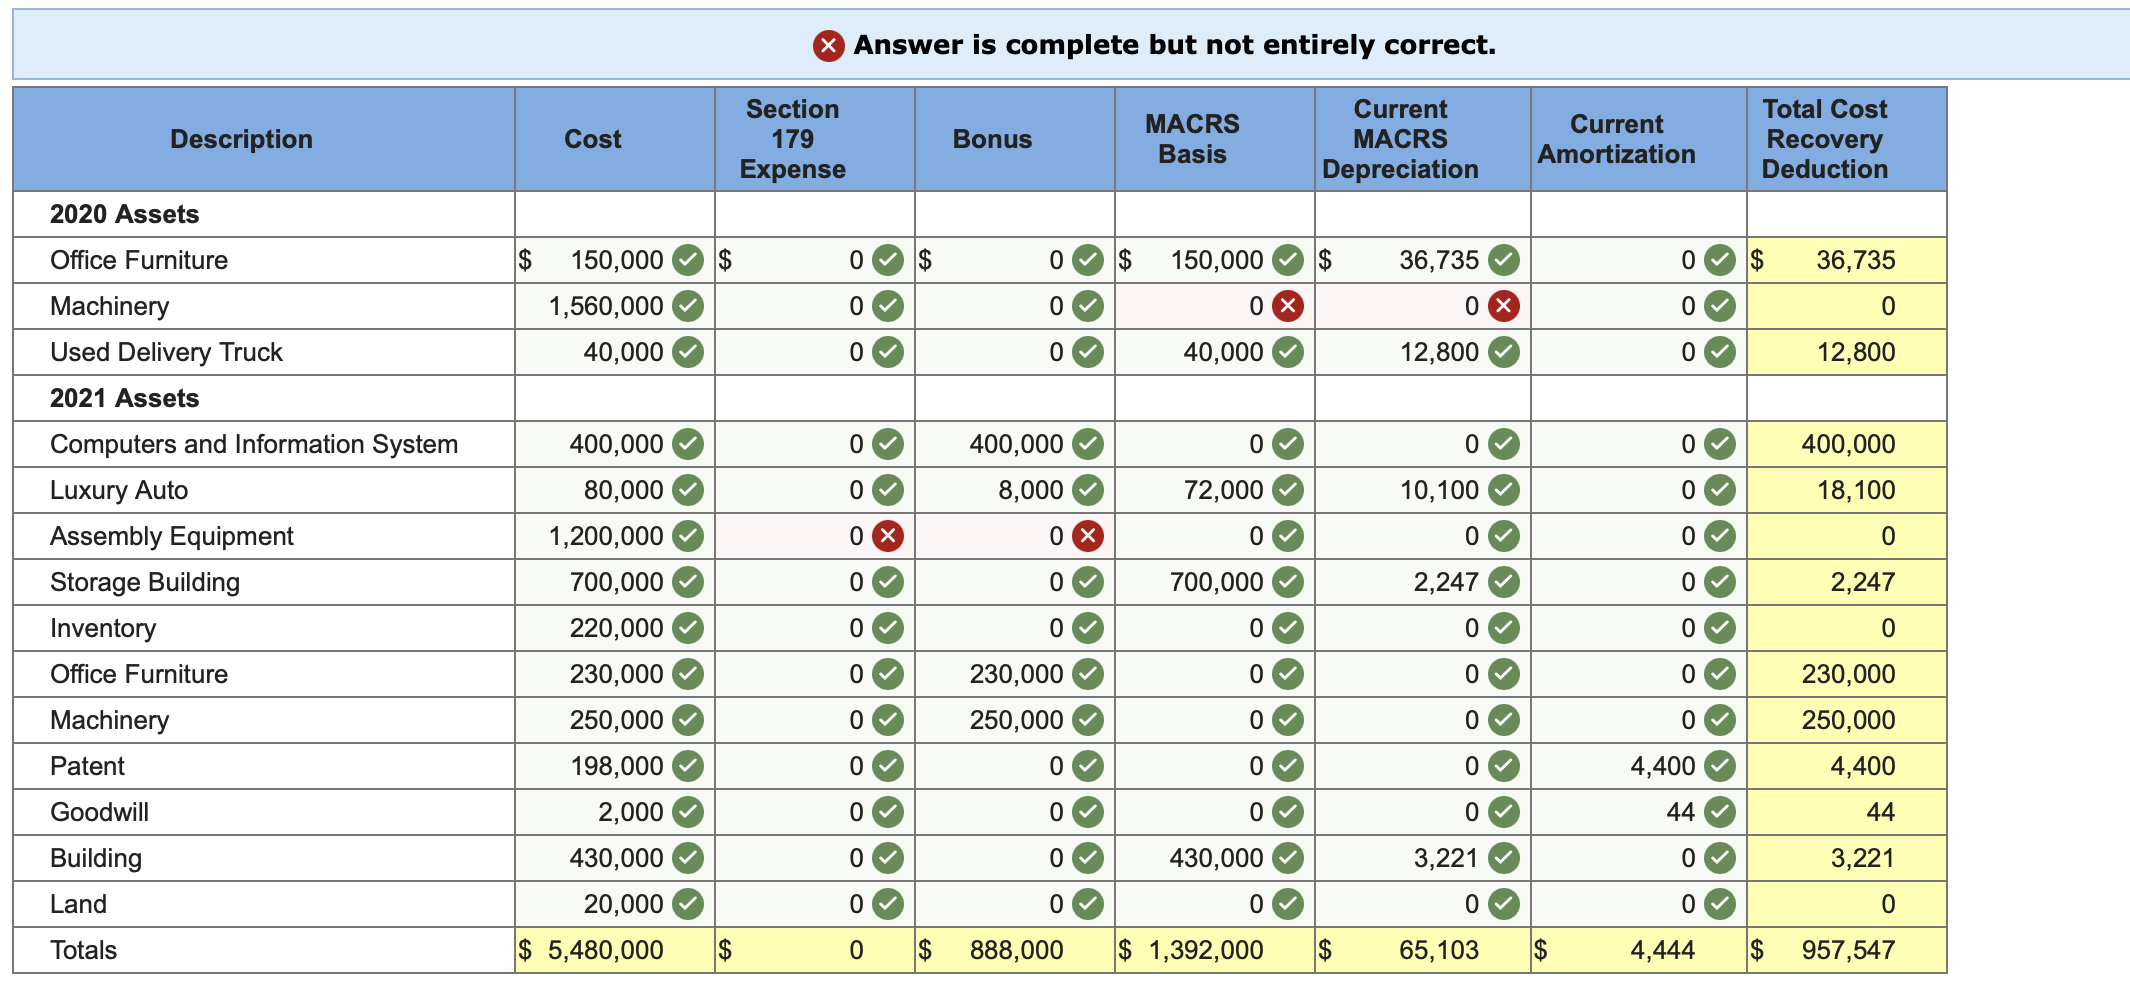
Karane Enterprises, a calendar-year manufacturer based in College Station, Texas, began business in 2020. In the process of setting up the business, Karane has acquired various types of assets. Below is a list of assets acquired during 2020: Asset Date Placed in Service 02/03/2020 Office furniture Cost $ 150,000 1,560,000 40,000 Machinery 07/22/2020 Used delivery truck* 08/17/2020 *Not considered a luxury automobile. During 2020, Karane was very successful (and had no 179 limitations) and decided to acquire more assets in 2021 to increase its production capacity. These are the assets acquired during 2021: Date Placed in Service Asset Cost $ 400,000 Computers and information system Luxury autot 03/31/2021 05/26/2021 80,000 Assembly equipment 1,200,000 08/15/2021 Storage building 700,000 11/13/2021 tUsed 100% for business purposes. Karane generated taxable income in 2021 of $1,732,500 for purposes of computing the 179 expense limitation. (Use MACRS Table 1, Table 2, Table 3, Table 4, Table 5, and Exhibit 10-10.) (Leave no answer blank. Enter zero if applicable. Input all the values as positive numbers.) Required: a. Compute the maximum 2020 depreciation deductions, including 179 expense (ignoring bonus depreciation). X Answer is complete but not entirely correct. Description 179 Expense Cost Total Cost Recovery MACRS Basis Current MACRS Depreciation Deduction $ 150,000 $ 21,435 1,560,000 0 40,000 8,000 $ 1,750,000 $ 29,435 Office furniture Machinery Used delivery truck Total 0 0X 0 0 $ $ 150,000 $ 0x 40,000 190,000 $ 21,435 $ 0 X 8,000 29,435 $ EXHIBIT 10-10 Automobile Depreciation Limits Year Placed in Service Recovery Year 2021* 2020 2019 2018 1 10,100** 10,100** 10,100** 10,000** 2 16,100 16,100 16,100 16,000 3 9,700 9,700 9,700 9,600 4 and after 5,760 5,760 5,760 5,760 *As of press date, the IRS had not released the 2021 limitations for automobiles, so throughout the chapter we use the same limitations as in 2020 for 2021. **$8,000 additional depreciation is allowed when bonus depreciation is claimed [168(k)(2)(F)]. TABLE 5 Nonresidential Real Property Mid-Month Convention Straight Line39 Years (for assets placed in service on or after May 13, 1993) Month Property Placed in Service Month 6 Month 1 2.461% 2.564 Month 2 2.247% 2.564 Year 1 Month 3 2.033% 2.564 Month 4 1.819% Month 5 1.605% 1.391% Month 7 1.177% 2.564 Month 8 0.963% 2.564 Month 9 0.749% 2.564 Year 2-39 2.564 2.564 2.564 Year 40 0.107 0.321 0.535 0.749 0.963 1.177 1.391 1.605 1.819 Month 10 0.535% 2.564 2.033 Month 11 0.321% 2.564 2.247 Month 12 0.107% 2.564 2.461 TABLE 4 Nonresidential Real Property Mid-Month Convention Straight Line-31.5 Years (for assets placed in service before May 13, 1993) Month Property Placed in Service Month 5 Month 6 Month 7 Month 8 Month 1 3.042% Month 2 2.778% Month 3 2.513% Month 4 2.249% Month 9 0.926% 1.984% 1.720% 1.455% 1.190% Year 1 Year 2-7 3.175 3.175 3.175 3.175 3.175 3.175 3.175 3.175 3.175 Year 8 3.175 3.174 3.175 3.174 3.175 3.174 3.175 3.175 3.175 Year 9 3.174 3.175 3.174 3.175 3.174 3.175 3.174 3.175 3.174 Year 10 3.175 3.174 3.175 3.174 3.175 3.174 3.175 3.174 3.175 Year 11 3.174 3.175 3.174 3.175 3.174 3.175 3.174 3.175 3.174 Year 12 3.175 3.174 3.175 3.174 3.175 3.174 3.175 3.174 3.175 Year 13 3.174 3.175 3.174 3.175 3.174 3.175 3.174 3.175 3.174 Year 14 3.175 3.174 3.175 3.174 3.175 3.174 3.175 3.174 3.175 Year 15 3.174 3.175 3.174 3.175 3.174 3.175 3.174 3.175 3.174 Year 16 3.175 3.174 3.175 3.174 3.175 3.174 3.175 3.174 3.175 Year 17 3.174 3.175 3.174 3.175 3.174 3.175 3.174 3.175 3.174 Year 18 3.175 3.174 3.175 3.174 3.175 3.174 3.175 3.174 3.175 Year 19 3.174 3.175 3.174 3.175 3.174 3.175 3.174 3.175 3.174 Year 20 3.175 3.174 3.175 3.174 3.175 3.174 3.175 3.174 3.175 Year 21 3.174 3.175 3.174 3.175 3.174 3.175 3.174 3.175 3.174 Year 22 3.175 3.174 3.175 3.174 3.175 3.174 3.175 3.174 3.175 Year 23 3.174 3.175 3.174 3.175 3.174 3.175 3.174 3.115 3.174 Year 24 3.175 3.174 3.175 3.174 3.175 3.174 3.175 3.174 3.175 Year 25 3.174 3.175 3.174 3.175 3.174 3.175 3.174 3.175 3.174 Year 26 3.175 3.174 3.175 3.174 3.175 3.174 3.175 3.174 3.175 Year 27 3.174 3.175 3.174 3.175 3.174 3.175 3.174 3.175 3.174 Year 28 3.175 3.174 3.175 3.174 3.175 3.174 3.175 3.174 3.175 Year 29 3.174 3.175 3.174 3.175 3.174 3.175 3.174 3.175 3.174 Year 30 3.175 3.174 3.175 3.174 3.175 3.174 3.175 3.174 3.175 Year 31 3.174 3.175 3.174 3.175 3.174 3.175 3.174 3.175 3.174 Year 32 1.720 1.984 2.249 2.513 2.778 3.042 3.175 3.174 3.175 Year 33 0.132 0.397 0.661 Month 10 0.661% 3.175 3.175 3.175 3.174 3.175 3.174 3.175 3.174 3.175 3.174 3.175 3.174 3.175 3.174 3.175 3.174 3.175 3.174 3.175 3.174 3.175 3.174 3.175 3.174 3.175 3.174 0.926 Month 11 0.397% 3.175 3.175 3.174 3.175 3.174 3.175 3.174 3.175 3.174 3.175 3.174 3.175 3.174 3.175 3.174 3.175 3,174 3.175 3.174 3.175 3.174 3.175 3.174 3.175 3.174 3.175 1.190 Month 12 0.132% 3.175 3.175 3.175 3.174 3.175 3.174 3.175 3.174 3.175 3.174 3.175 3.174 3.175 3.174 3.175 3.174 3.175 3.174 3.175 3.174 3.175 3.174 3.175 3.174 3.175 3.174 1.455 T TABLE 2a MACRS Mid-Quarter Convention: For property placed in service during the first quarter Depreciation Rate for Recovery Period 5-Year 7-Year Year 1 35.00% 25.00% Year 2 26.00 21.43 Year 3 15.60 15.31 Year 4 11.01 10.93 Year 5 11.01 8.75 Year 6 1.38 8.74 Year 7 8.75 Year 8 1.09 TABLE 26 MACRS Mid-Quarter Convention: For property placed in service during the second quarter Depreciation Rate for Recovery Period 5-Year 7-Year Year 1 25.00% 17.85% Year 2 30.00 23.47 Year 3 18.00 16.76 Year 4 11.37 11.97 Year 5 11.37 8.87 Year 6 4.26 8.87 Year 7 8.87 Year 8 3.34 TABLE 2c MACRS Mid-Quarter Convention: For property placed in service during the third quarter Depreciation Rate for Recovery Period 5-Year 7-Year Year 1 15.00% 10.71% Year 2 34.00 25.51 Year 3 20.40 18.22 Year 4 12.24 13.02 Year 5 11.30 9.30 Table 1 MACRS Half-Year Convention 3-Year Year 1 33.33% Year 2 44.45 Year 3 14.81 Year 4 7.41 Year 5 Year 6 Year 7 Year 8 Year 9 Year 10 Year 11 Year 12 Year 13 Year 14 Year 15 Year 16 Year 17 Year 18 Year 19 Year 20 Year 21 Depreciation Rate for Recovery Period 5-Year 20.00% 32.00 19.20 11.52 11.52 5.76 7-Year 10-Year 15-Year 20-Year 14.29% 10.00% 5.00% 3.750% 24.49 18.00 9.50 7.219 17.49 14.40 8.55 6.677 12.49 11.52 7.70 6.177 8.93 9.22 6.93 5.713 8.92 7.37 6.23 5.285 8.93 6.55 5.90 4.888 4.46 6.55 5.90 4.522 6.56 5.91 4.462 6.55 5.90 4.461 3.28 5.91 4.462 5.90 4.461 5.91 4.462 5.90 4.461 5.91 4.462 2.95 4.461 4.462 4.461 4.462 4.461 2.231 Required: c. Compute the maximum 2021 depreciation deductions, including 179 expense, but now assume that Karane would like to take bonus depreciation. X Answer is complete but not entirely correct. Description Cost Section 179 Expense Bonus MACRS Basis Total Cost Recovery Deduction 2020 Assets Office Furniture $ 150,000 $ $ Machinery 1,560,000 36,735 0 12,800 Used Delivery Truck 40,000 2021 Assets 400,000 Computers and Information System Luxury Auto 18,100 400,000 80,000 1,200,000 700,000 Assembly Equipment 0 Storage Building 2,247 Total $ 4,130,000 $ 469,882 $ 0 0 0 0 0 0X 0 0x 0 0 $ 408,000 0 0 0 400,000 8,000 $ $ Current MACRS Depreciation 36,735 12,800 0 10,100 0 2,247 61,882 150,000 $ 0 X 40,000 0 72,000 0 700,000 962,000 0X Required: d. Now assume that during 2021, Karane decides to buy a competitor's assets for a purchase price of $1,350,000. Compute the maximum 2021 cost recovery, including 179 expense and bonus depreciation. Karane purchased the following assets for the lump- sum purchase price: (Round your final answers to the nearest whole dollar amount.) Date Placed in Service Asset Cost Inventory $ 220,000 09/15/2021 Office furniture 09/15/2021 230,000 250,000 198,000 Machinery Patent 09/15/2021 09/15/2021 2,000 09/15/2021 Goodwill Building Land 430,000 09/15/2021 20,000 09/15/2021 Assume that Karane takes the maximum section 179 expense for the Assembly Equipment. Description 2020 Assets Office Furniture Machinery Used Delivery Truck 2021 Assets Computers and Information System Luxury Auto Assembly Equipment Storage Building Inventory Office Furniture Machinery Patent Goodwill Building Land Totals Cost $ 150,000 1,560,000 40,000 400,000 80,000 1,200,000 700,000 220,000 230,000 250,000 198,000 2,000 430,000 20,000 $ 5,480,000 $ Section 179 Expense Answer is complete but not entirely correct. Bonus MACRS Basis Current MACRS Depreciation 36,735 12,800 0 10,100 0 2,247 0 0 0 0 0 3,221 0 65,103 0 0 0 0 0 0 X 0 0 0 0 0 0 0 0 0 $ $ 0 0 400,000 8,000 0x 0 230,000 250,000 0 0 0 888,000 150,000 $ 0 X 40,000 0 72,000 0 700,000 0 0 0 0 430,000 0 $ 1,392,000 $ $ 0X Current Amortization 0 0 0 0 0 0 0 0 0 0 4,400 44 0 0 4,444 $ Total Cost Recovery Deduction $ 36,735 0 12,800 400,000 18,100 0 2,247 0 230,000 250,000 4,400 44 3,221 0 957,547 $
Step by Step Solution
There are 3 Steps involved in it

Get step-by-step solutions from verified subject matter experts