

Question: Please answer the qeustion: In the output, no t-tests are significant at =0.05, but the F-test for regression has a p-value of approximately 0. The
Please answer the qeustion:
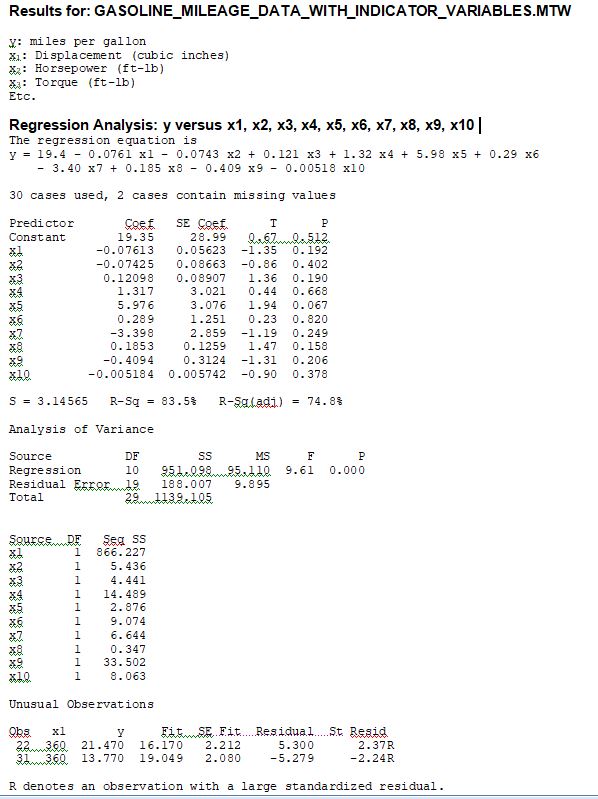
In the output, no t-tests are significant at =0.05, but the F-test for regression has a p-value of approximately 0. The best explanation of these results is: O These regressors are not useful predictors O Multicollinearity is present O All these regressors are useful predictors O Only first variable x1 is a useful predictorResults for: GASOLINE_MILEAGE_DATA_WITH_INDICATOR_VARIABLES.MTW Y: miles per gallon *1: Displacement (cubic inches) *: Horsepower (ft-1b) Ma: Torque (ft-1b) Etc. Regression Analysis: y versus x1, x2, x3, x4, x5, x6, x7, x8, x9, x10 | The regression equation is y = 19.4 - 0.0761 x1 - 0.0743 x2 + 0. 121 x3 + 1. 32 x4 + 5.98 x5 + 0.29 x6 - 3. 40 x7 + 0.185 x8 - 0.409 x9 - 0.00518 x10 30 cases used, 2 cases contain missing values Predictor SE COST P Constant 19.35 28.99 -0.07613 0.05623 -1. 35 0. 192 -0. 07425 0.08663 -0.86 0. 402 0. 12098 0. 08907 1.36 0. 190 1. 317 3. 021 0. 44 0. 668 5.976 3.076 1. 94 0. 067 0.289 1 . 251 0.23 0. 820 -3.398 2.859 -1. 19 0. 249 #8. 0. 1853 0. 1259 1 . 47 0. 158 -0. 4094 0. 3124 -1.31 0. 206 -0.005184 0.005742 -0.90 0. 378 5 = 3.14565 R-Sq = 83.5$ R-Sqladi ) = 74.84 Analysis of Variance Source DF SS MS F P Regression 10 951 098 95 110 9.61 0.000 Residual 188.007 9.895 Total 866. 227 5. 436 4. 441 14. 489 2. 876 9. 074 6. 644 0. 347 33. 502 8. 063 Unusual Observations x1 Y Sales. Fit....Residual.....St. Reaid. 21 .470 16.170 2.212 5.300 2.37R 13.770 19.049 2.080 -5.279 -2. 24R R denotes an observation with a large standardized residual
Step by Step Solution
There are 3 Steps involved in it

Get step-by-step solutions from verified subject matter experts