Question: please answer the question a,b,c,d thanks! In this problem, we focus on a generalized version of t-distribution. Specifically, it has a location parameter m and
please answer the question a,b,c,d thanks!
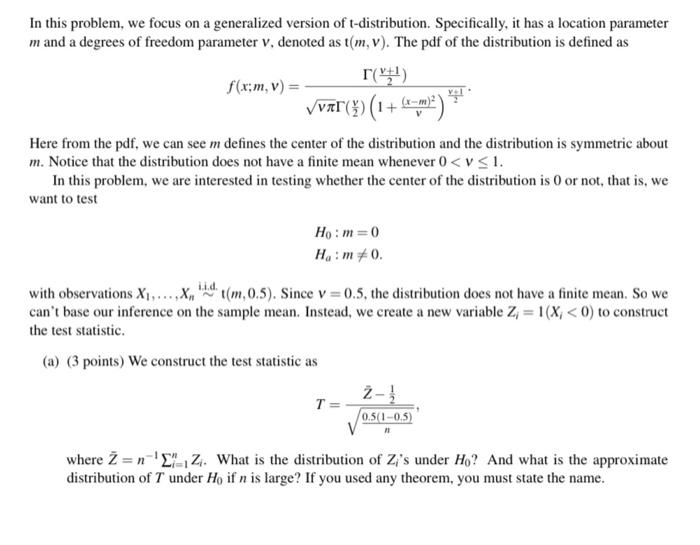
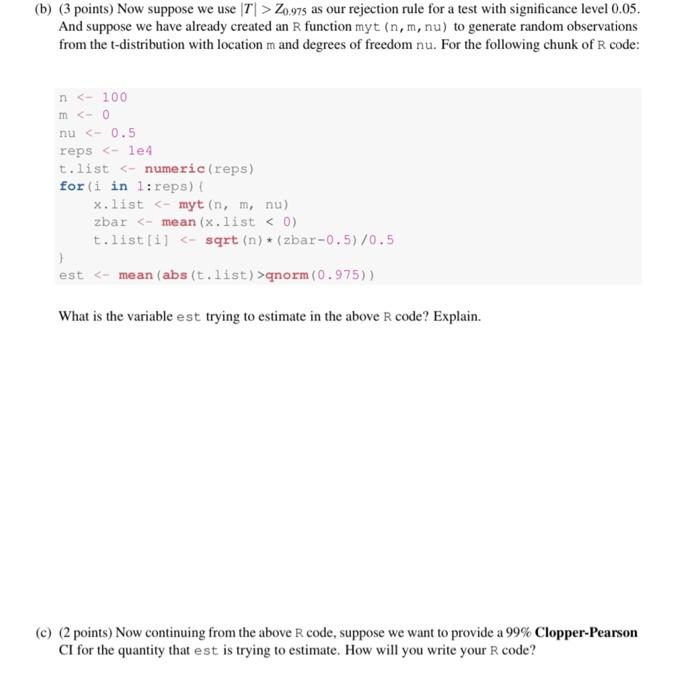
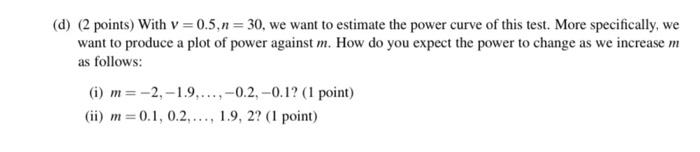
In this problem, we focus on a generalized version of t-distribution. Specifically, it has a location parameter m and a degrees of freedom parameter v, denoted as t(m,v). The pdf of the distribution is defined as r(1) f(x;m, v) = Vvr(y)(1+42mm*) Here from the pdf, we can see m defines the center of the distribution and the distribution is symmetric about m. Notice that the distribution does not have a finite mean whenever 0 Z0.975 as our rejection rule for a test with significance level 0.05. And suppose we have already created an R function myt (n,m, nu) to generate random observations from the t-distribution with location m and degrees of freedom nu. For the following chunk of R code: n qnorm(0.975)) What is the variable est trying to estimate in the above R code? Explain. (c) (2 points) Now continuing from the above R code, suppose we want to provide a 99% Clopper-Pearson CI for the quantity that est is trying to estimate. How will you write your R code? (d) (2 points) With v=0.5.n= 30, we want to estimate the power curve of this test. More specifically, we want to produce a plot of power against m. How do you expect the power to change as we increase m as follows: (1) m= -2,-1.9,...,-0.2 -0.12 (1 point) (ii) m=0.1, 0.2,..., 1.9, 2? (1 point) In this problem, we focus on a generalized version of t-distribution. Specifically, it has a location parameter m and a degrees of freedom parameter v, denoted as t(m,v). The pdf of the distribution is defined as r(1) f(x;m, v) = Vvr(y)(1+42mm*) Here from the pdf, we can see m defines the center of the distribution and the distribution is symmetric about m. Notice that the distribution does not have a finite mean whenever 0 Z0.975 as our rejection rule for a test with significance level 0.05. And suppose we have already created an R function myt (n,m, nu) to generate random observations from the t-distribution with location m and degrees of freedom nu. For the following chunk of R code: n qnorm(0.975)) What is the variable est trying to estimate in the above R code? Explain. (c) (2 points) Now continuing from the above R code, suppose we want to provide a 99% Clopper-Pearson CI for the quantity that est is trying to estimate. How will you write your R code? (d) (2 points) With v=0.5.n= 30, we want to estimate the power curve of this test. More specifically, we want to produce a plot of power against m. How do you expect the power to change as we increase m as follows: (1) m= -2,-1.9,...,-0.2 -0.12 (1 point) (ii) m=0.1, 0.2,..., 1.9, 2? (1 point)